


Markets closed this week at new all-time highs, and many attributed this to the consumer inflation data that came out on Wednesday. When the consumer price index (CPI) came out on Wednesday, the initial jolt to the market kicked off with a positive flavor as investors were gearing up to place their bets on the FED interest rate cuts.
At all-time highs, the S&P 500 closed above 5300, and the Dow Jones (DJ) was able to top over 40,000 on Thursday. The bulls have certainly stepped in after a period of consolidation, and much to our forecast, most major indexes are now back in the uptrend. As our blog on April 27, 2024 stated, "There is a current counter-rally occurring in the market...However, our internal algorithms suggest that the probability of this rally continuing to regain all-time highs is very low. The likely scenario is that the counter rally stops short of all-time highs, and the next move is lower. This means there is potential for the 4953 support region to be tested. A break of this will mean we are headed to the low end of the 4800 area." Markets can consolidate and regain footing in May and want to push even higher. Let's take a look at what has happened since our last blog.
Big Picture
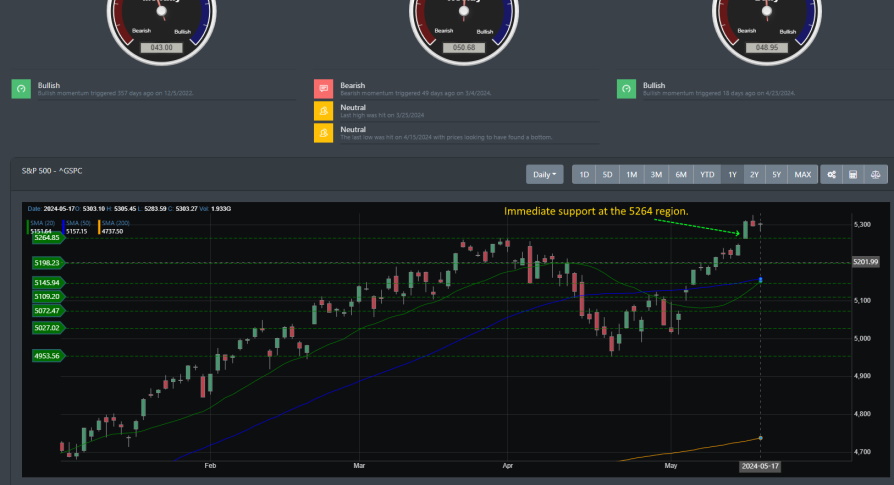
Markets are looking at clear blue skies, and the S&P 500 is at all-time highs. The last time we blogged, markets had a pullback, dropping to hit 5027 before pushing higher. Looking at the chart below of the S&P 500, we can see that the 5264 region is supported. The next immediate resistance is now around the 5420 region. There is no clear sign that markets are topping at this point.
Market Breadth
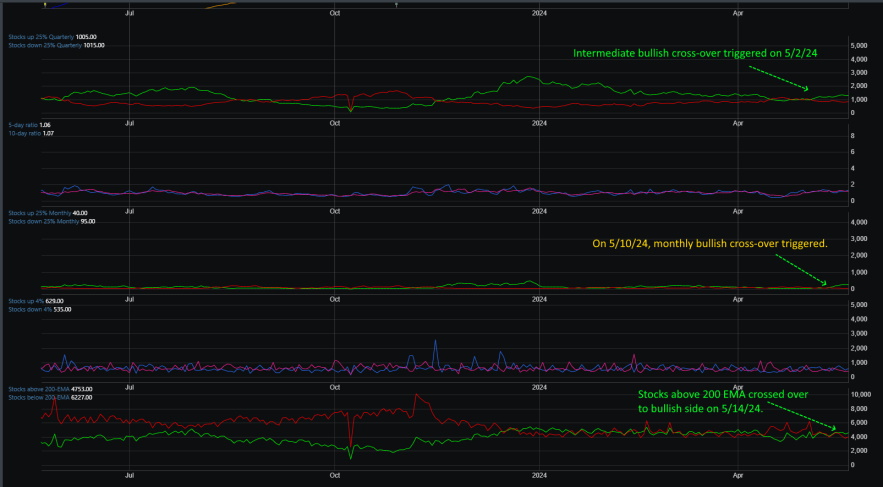
There have been some key bullish triggers in our market breadth readings that further speak to the recent strong push by the financial markets. Our prior blog looked at the case where market dynamics were neutral but leaning bearish. It is incredible how just a few weeks have changed the dynamics of the technical readings. It may start with a positive intermediate bullish cross when the trigger strongly indicates how markets will move. We also received a monthly bullish cross, which has been stagnant for most of the year. It triggered on May 10, 2024, and markets took off from there.
Market Sentiment
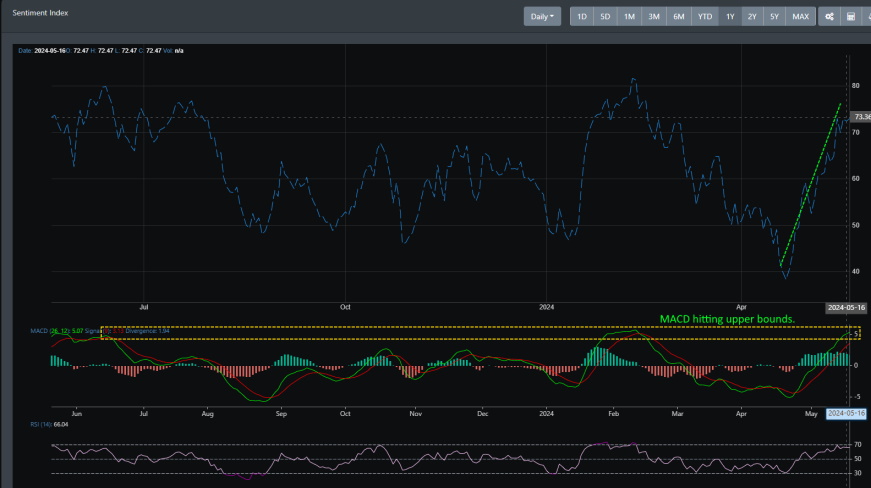
It is clear where market sentiment is currently at. Though the reading is relatively high historically, we expect the market sentiment to continue even if a dip occurs in the near term. But historically, for the past five years, market sentiment has only hit above eight times—the last time being on 2/9/24, when markets did dip before continuing higher.
Market Outlook
Markets continue to support the last monthly bullish buy signal set on November 1, 2023. All major indices were off to the races when that market signal was triggered. We are now in uncharted territory where markets look at an upward ascent. However, this was not the case a month ago. What changes occurred that caused the reversal of market sentiment and market direction? Let's look at the charts below to get an idea.
SPY
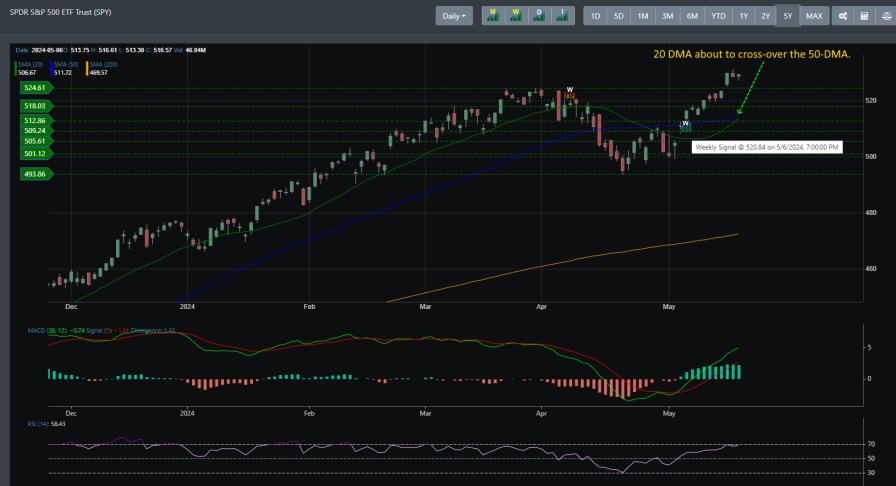
On 4/8/24, SPY received a weekly bearish sell signal showing a clear uptrend break. Price movement declined to the point where market sentiment started to reverse, and it was unclear at the time if markets were topping. However, that changed recently when, on May 6, 2024, SPY received its weekly bullish buy signal. The rest, as they say, is history. SPY is now at all-time highs.
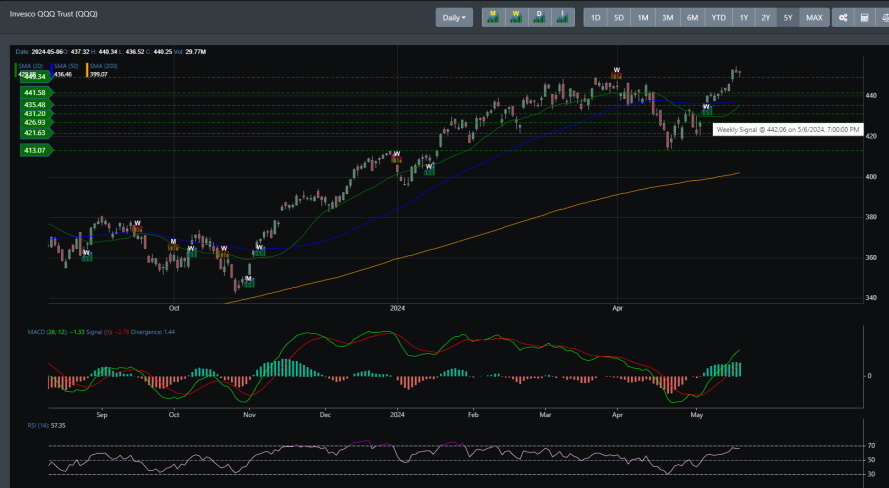
QQQ
QQQ received its weekly bearish sell signal on April 1, 2024. Like SPY, it also had a pullback that broke the uptrend. Since receiving its weekly buy signal, QQQ has hit all-time highs.
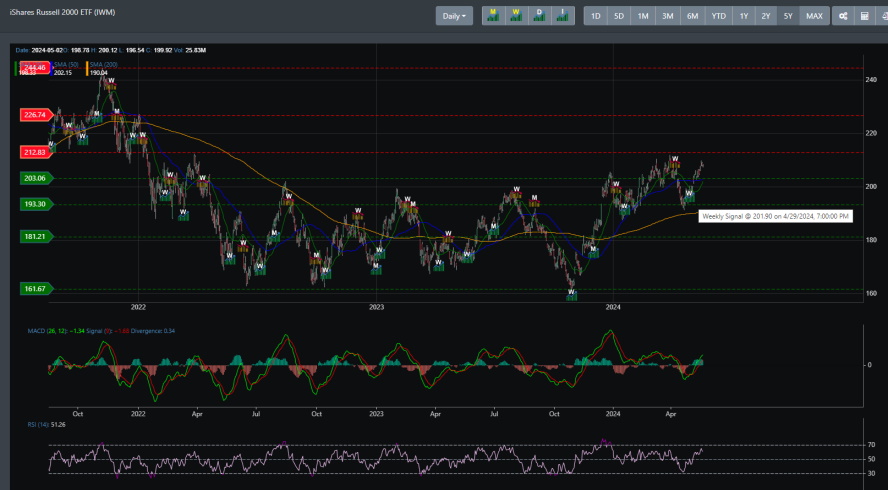
IWM
IWM broke out of its range-bound when it received its monthly buy signal on December 1, 2023. However, it is now having trouble breaking resistance, currently at the 212 region. If we view the weekly timeframe, there is a strong indication that IWM is poised for a strong rally.
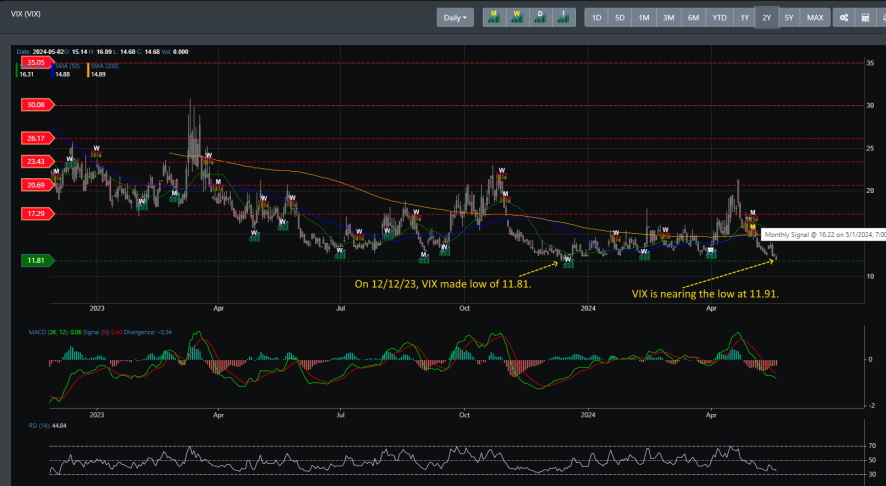
VIX
It is incredible how just a month can change the fortune of the markets. VIX received a monthly bullish signal on April 1, 2024. From there, markets started their pullback. However, there has been a monthly sell signal that was received on May 1, 2024. Markets have recovered their uptrend since VIX's sell signal. However, VIX is poised to hit its low that was set back on December 12, 23. A low reading is nothing historically to be alarmed about but provides some context in that a minor pullback could be in the cards in the near term.
Concluding
The S&P 500 is now looking straight up with no apparent resistance. There is still a high probability of a minor pullback or consolidation as near-term technical readings are overbought. However, the uptrend is intact; the next resistance level is at the 5420 region. If a pullback did occur, 5264 is supported. Any break below this would lead to support at the 5200 region. Additionally, IWM can be worrisome as it now failed to continue its breakout from this year. Immediate support is at the 204 region and the next line of support is at 201. Any break of this could indicate a high probability that we could be topping out.