or more like after reaching overbought levels. Though August 2020 certainly ended with all major indexes hitting all-time highs, September started off with a drop late last week. Last week on Tuesday and Wednesday, Wall street was reigning in with optimism. Then heavy selling pressure (high volume) pushed the S&P 500 lower to near 3427. This occurred on Thursday and Friday.
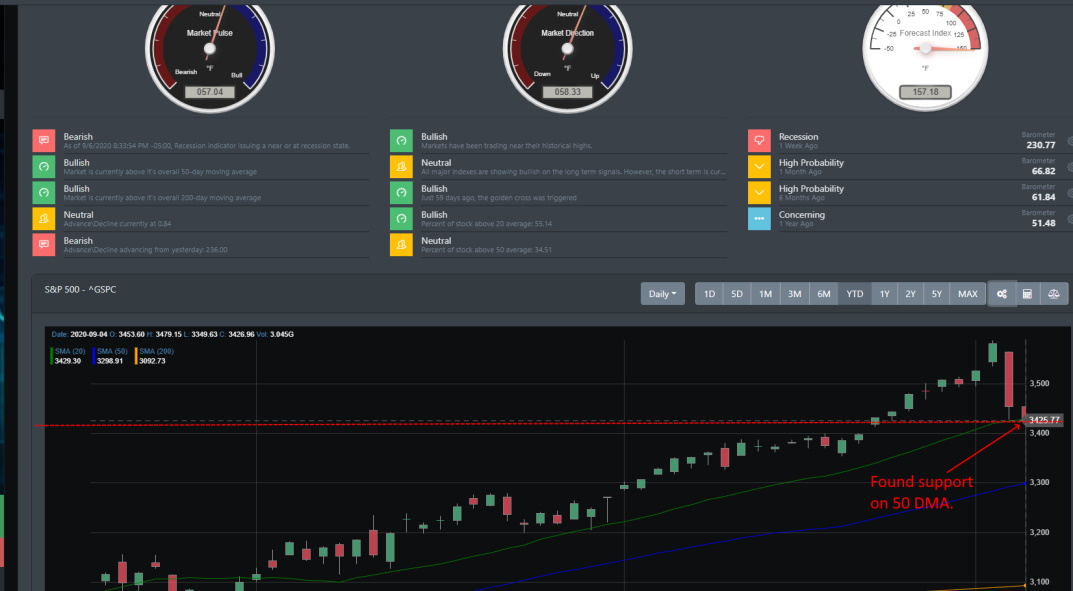
BullGap's Big Picture analysis dashboard shows the S&P 500 dropping to find support around 3425. Just right near the 50 daily moving average (DMA). If this support fails for the coming week, the next leg down could be at around 3225. That is 6.5% lower. The next significant drop would be around 2860. A decline of around 18%.
Right now, Bullgap's breadth and momentum are readying around ~57. In August, both readings were at a high of at least 85 and above. The percentage of stocks above the 50 DMA has dropped to 34 percent. As discussed recently in our last couple of blogs, the Advance\Decline line has been trending lower while the S&P and Nasdaq have been hitting all-time highs. Market breadth was narrow and only a handful of technology companies were pulling the indexes up.
Breaking through trend lines
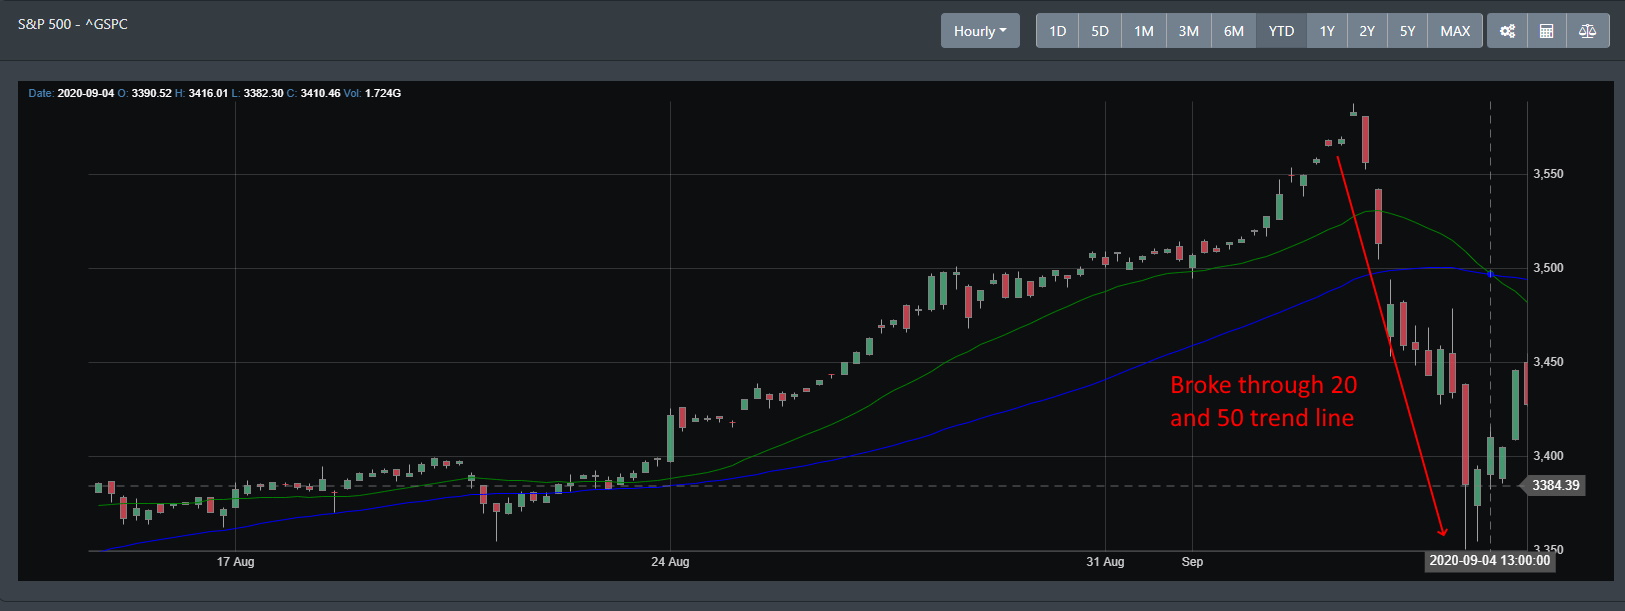
If we look at the hourly chart for the S&P 500, we can see that the market started selling off on the morning of Thursday 9/3/2020. It broke through multiple trend lines. The only good news out of last week's heavy sell-off was that the market spent most of Friday's afternoon rallying back up. That tells us that dip-buying was in full force and the bulls were not disenchanted by the drop of the past two days.
Overbought conditions
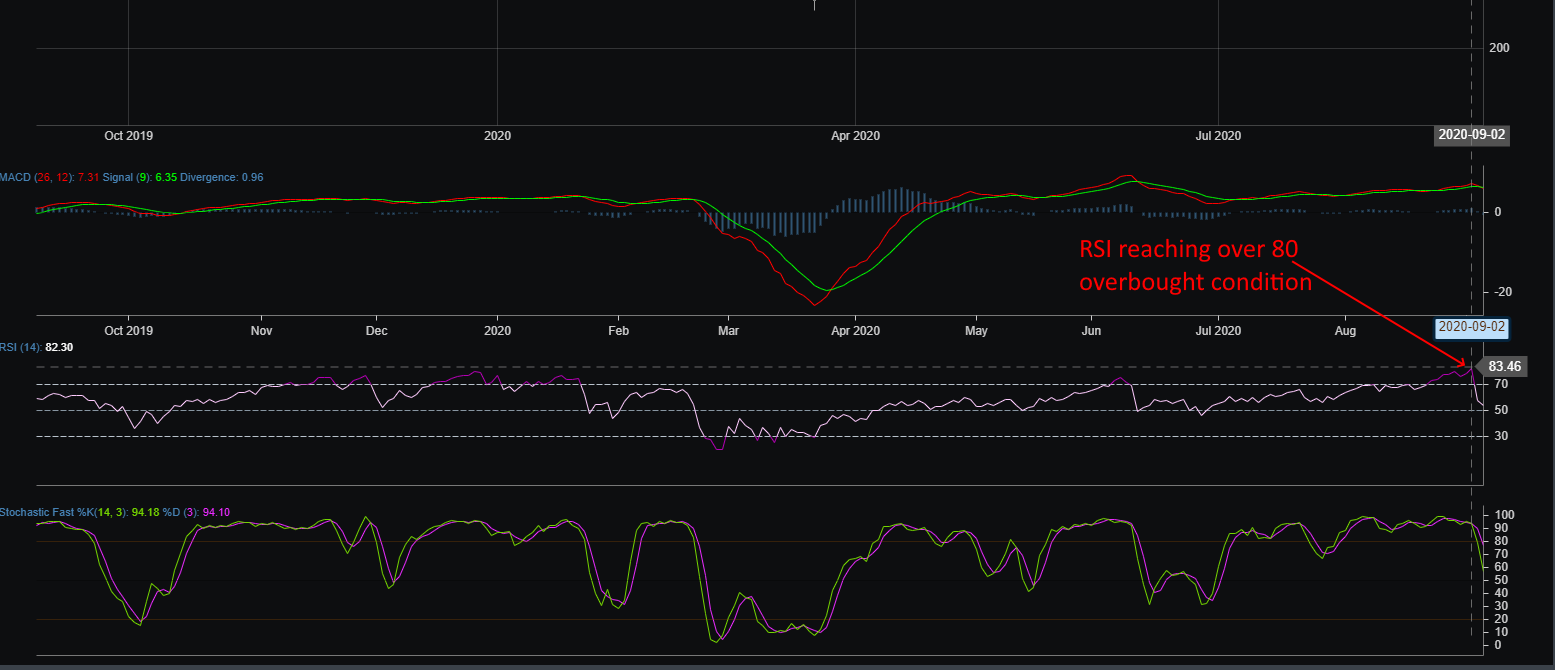
The RSI (14) reached extremely overbought levels late in August. The last time it hit this level was in June when another sell-off occurred. With overbought readings on multiple technical indicators and trading at 4 to 5 times standard deviation, the markets were definitely due for a correction.
Market Sentiment
Looking at BullGap's Fear and Greed baraometer, it was reading a high exhuberance in the market for past month. It reached its highest reading since post COVID-19 on August 28, 2020. The reading at that time was 70.72. When the market turned over in June, the index hit 68.53 (June 5th). Market sentinment has clearly now moved into the neutral range with the reading currently at 41.27.
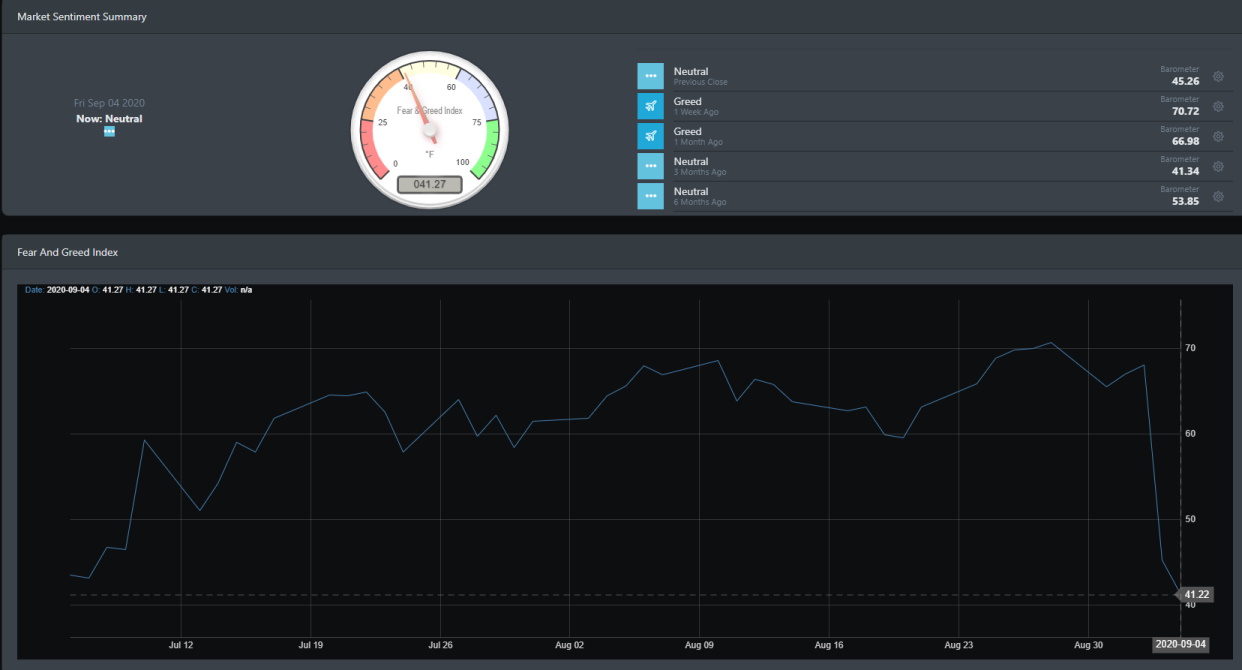
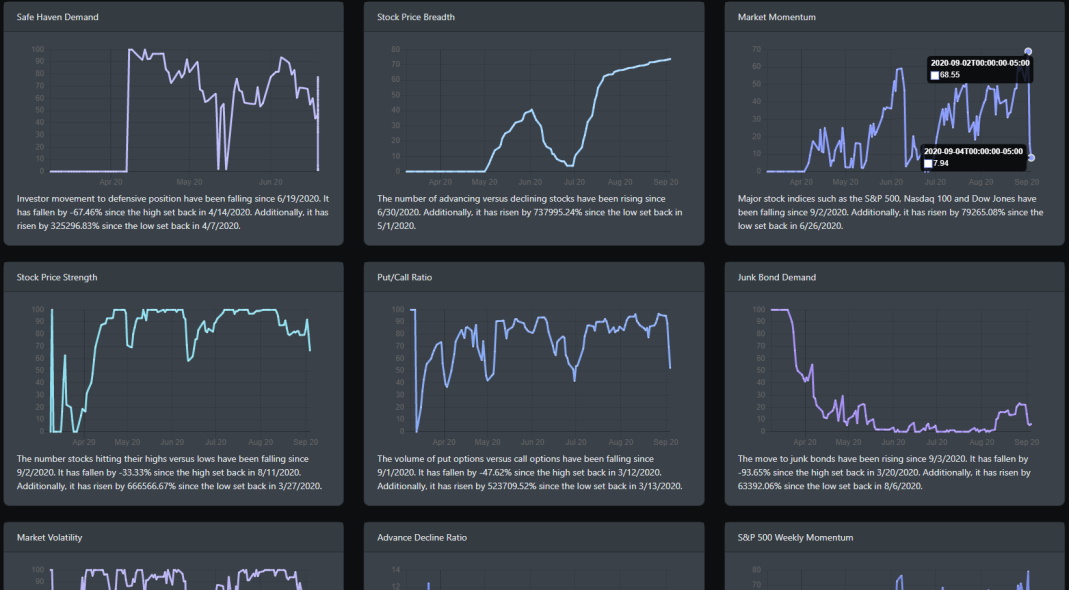
Looking at some of the components of the Fear and Greed index, you can see that market momentum had a sudden drop. On September 2, it wreached a high of 68.55. Now, it is currently at a low range of 7.94.
Conclusion
The rally in August pushed the major indexes such as the S&P 500, Nasdaq, and the Dow Jones into overbought conditions with trading at 4 to 5 their standard deviation. BullGap's Big Picture was ready a high gauge of over 85 for the entire month. Momentum was clearly driving the August rally. September and October are known historically for being a volatile time for the market. With a U.S. presidential election coming up, COVID-19 still looming and September being one of the worst-performing months for the S&P 500, it will be interesting to see how things pan out next week.


