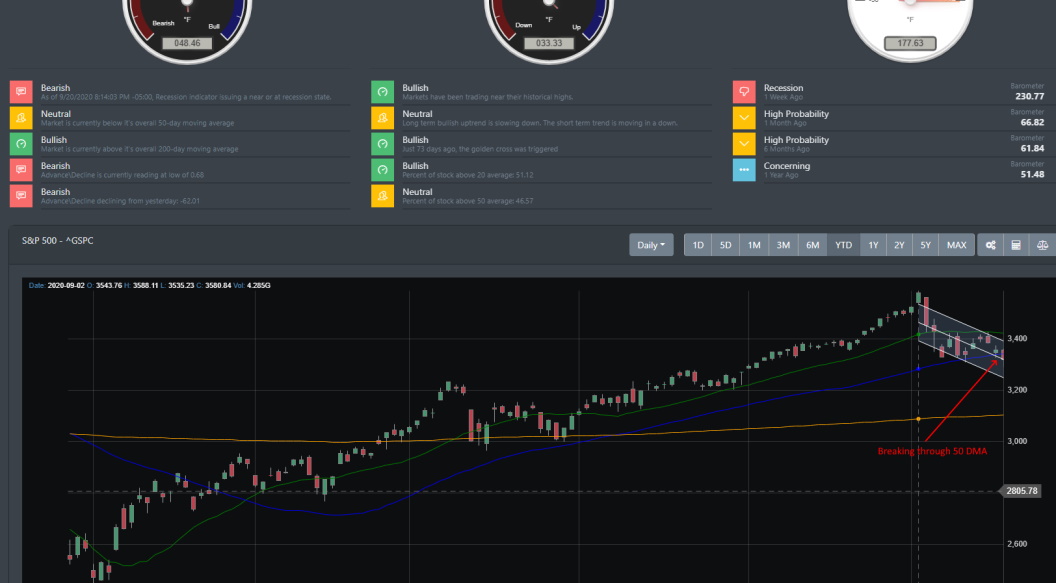
September blues are here. Since 1950, September has been on average the worst-performing month for the U.S markets. Major indices such as the S&P 500 typically decline by 1% in September. This month alone, the S&P 500 has declined by -5 percent. The Nasdaq leads the decline by -8 percent. The DOW is under -2.5 percent. Last week, nearly all major equity indexes have dropped to their 50-day moving average (DMA). For three consecutive weeks, all major indices are in decline. On September 17, 2020, the Fed came out and stated that they plan to keep Quantitative Easing(QE) to infinity. That did little to quell market confidence.
S&P 500 / SPX
For the first time since April, the S&P 500 gap lower late last week and fell below its 50-day moving average (DMA). SPX is currently at a key support level of 3300. If it falls this coming week, it could find support at the 3200 marks. Another technical breakdown could cause it to drop near 3000.
Nasdaq breakdown
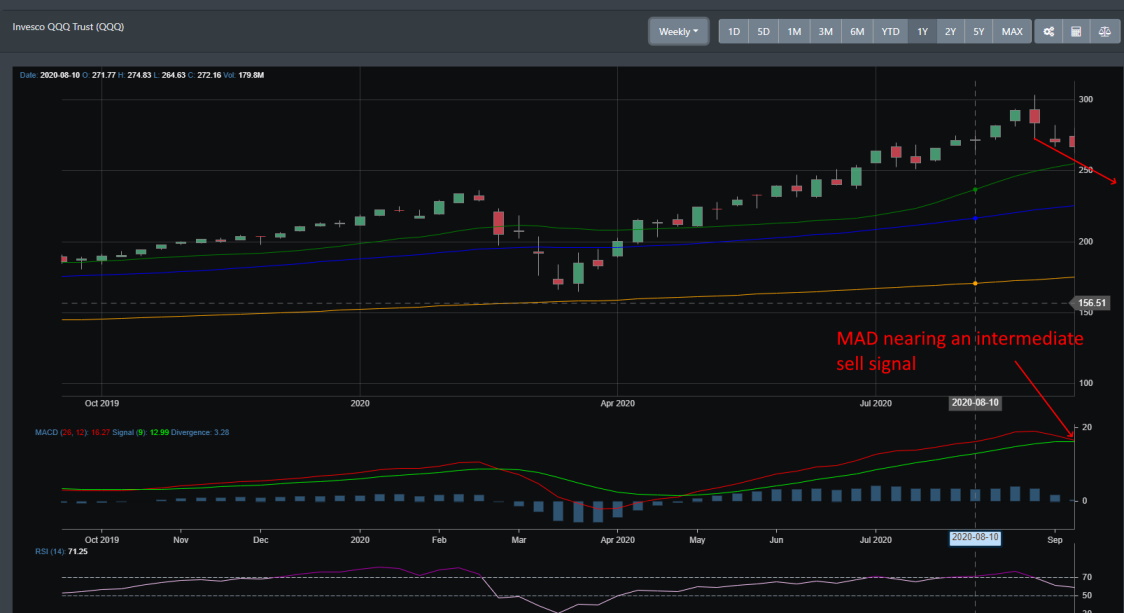
Like the S&P 500, QQQ also had a breakdown below its 50-DMA. QQQ is an ETF that tracks the Nasdaq 100. Because of its technology (AAPL, MSFT, AMZN, FB, GOOG) weighted composition, QQQ has led the market higher in the post-lockdown rally. This has changed in September and we can see multiple breakdowns in multiple time-frames.
If we look at the weekly timeframe, QQQ has been in a strong rally since April. Prices are now below the 50 DMA and 50-day EMA. The MACD indicator is nearing a cross-over which would indicate a sell signal on the intermediary time-frame.
FED complacency
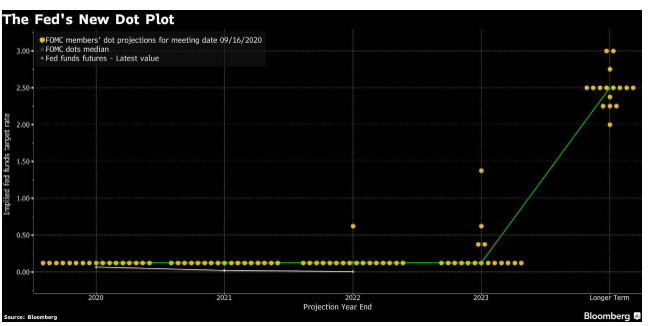
On September 17, 2020, the Fed announced that it will keep rates near zero until 2023. The FOMC kept the federal funds rate range from 0% to 0.25%. The Fed will continue their QE policy by purchasing over $120 billion per month of treasuries and mortgage-backed securities.
Money Supply
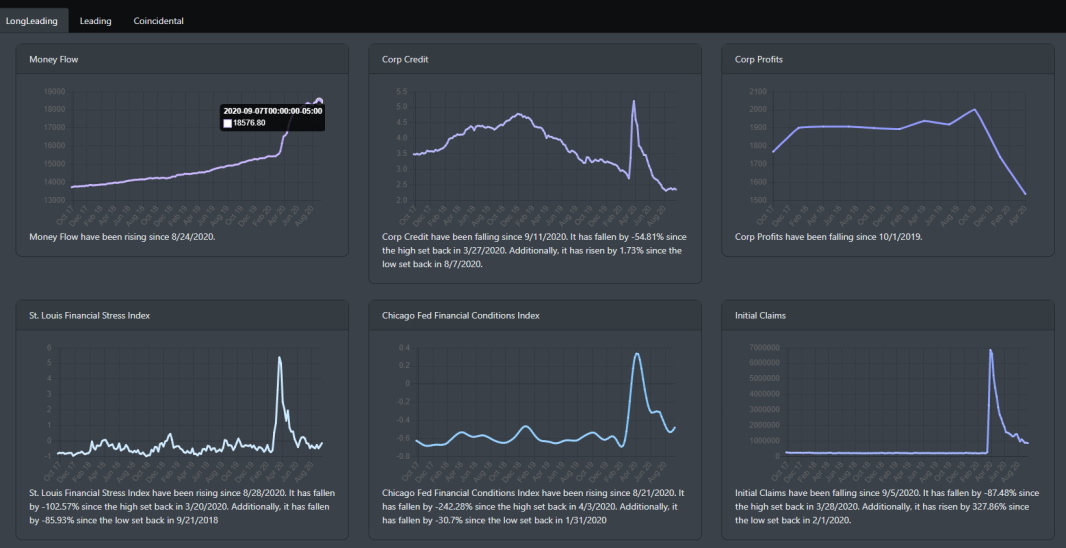
The fact is the Fed is trying to manage the large growth in the federal debt (now at over $3 trillion this year). The below chart shows how the market is amped up on liquidity. The money supply is already growing at a rate of greater than 20%. The economy however is not really able to absorb this when it is currently in a recession. Because of this, the money flows into the financial markets which have inflated the stock market and have caused the current market rally. This is great if you happen to be the top 10% of American households that own financial assets. It does not do anything for the other households that can barely create savings on their own.
Retail Sales and Consumer Confidence
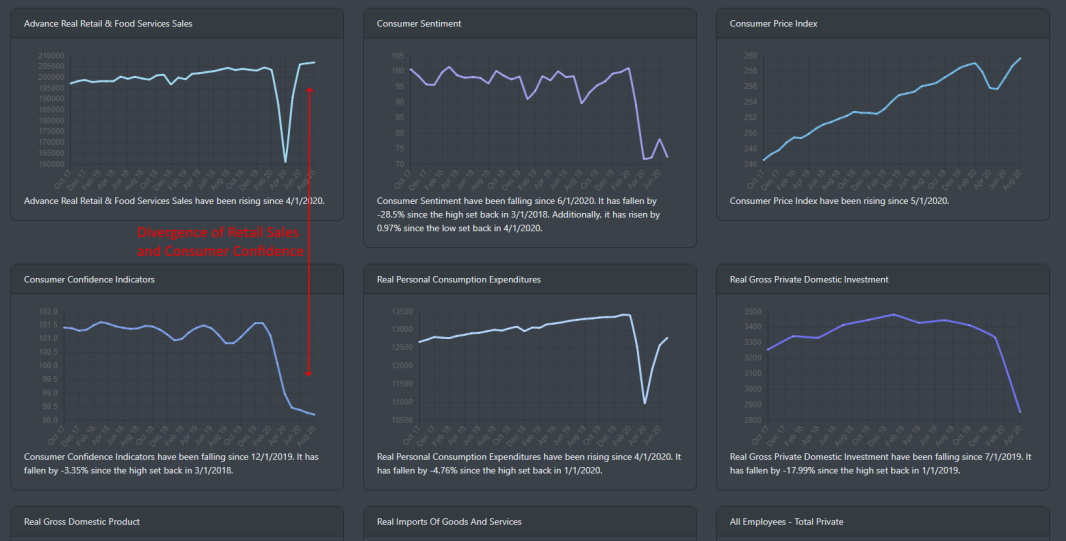
If we look at the Retail Sales numbers, it has literally made a V-shaped recovery. Historically, Real Retail Sales and Consumer Confidence correlate and track each other very closely. Consumer confidence usually equates to more spending and we can see that in the Retail Sales data. Looking at our data below, there is a clear divergence between these two data points.
The thought here is that the large divergence is due to the government stimulus package to consumers. Spending is being driven by the government's massive handout to Americans. As the stimulus bill fades, this could cause retail sales to significantly drop.
Conclusion
From a historical perspective, September is turning out to not disappoint. But if we look at the technical indicators for this month, this has been a textbook pullback. There has been no large volume of a sell-off which suggests that the market will eventually find a bottom and resume its move to the upside. At the very least in the near term.
While the technology sector is taking one on the chin, other sectors are holding up quite well. Communications, real estate, material, and industrial sectors were trading in the positive since the correction began this month.


