


When the Fed began raising interest rates back in 2022, there was hope from the trading community that the world of 0% interest would eventually come to pass. But months passed by in 2022, and those hopes were soon washed away as inflation continued to stay pesky. Fast forward to the beginning of 2024, and the consensus among investors was that the Fed would reduce the short-term interest rates. With inflation creeping on the Fed's 2% target, many believe it would have begun on early March 24 and will continue with rate cuts for the remainder of the year. With the price increase in several areas of the inflation readings - namely shelter, insurance, and medical care- the Personal Consumption Expenditures (PCE) price index has come in at about an annualized rate of more than 3.4%. To make matters worse, traders got hit this week with the GDP and inflation report showing prices continuing to increase.
But is this currently what is driving the market? Has a fear of inflation and Fed rate policy driven the cause of the current market pullback? Well, if you have been reading up on our past blogs, this certainly is not our view. It was not certain our view when rates were high in late 2022, and we called for a bullish rally in October 2022.
Additionally, in our last blog, Potential for more downside? We were calling for a high potential for a market pullback. This was back in late March when market sentiment was heavily bullish and markets were near all-time highs. We state the following:
"Are markets consolidating, or are they gearing up for a pullback? Right now, our data is showing markets poised for a pullback. Market breadth has stayed neutral, and we have yet to see a strong push in the bullish trend. Additionally, as noted above, weekly bearish signals trigger major indices that typically indicate a reversal. Though not all indices are triggering this sign, it is clear that there is a high probability that we see more downside in the coming weeks. It is still possible that this is a consolidation period, but markets will have to hold support and try to break through to resistance at the 5300 regions before we can see that a near topping is approaching."
Our analytical and machine learning software system identified the bearish signals before the news pundits started showering us with more inflation worries.
Big Picture
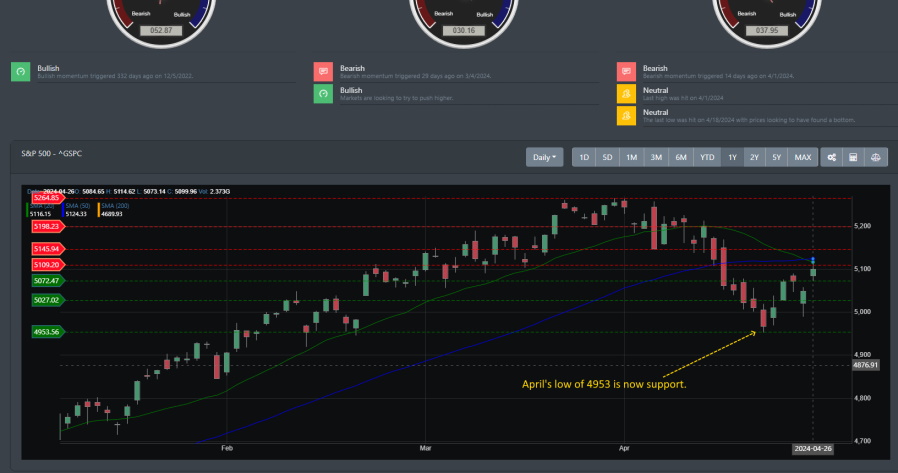
Only a month ago, most investors felt bullish about the financial markets. The idea of a Fed planning to reduce rates, an AI boom that has not provided much profit, was at the forefront of most investors and market pundits. However, market dynamics have changed, and in our last blog, we discussed some of the beginning signs of a market correction. That was a month ago, and now, looking at the chart below of the S&P 500, it is clear we are in a pullback now.
Are we set up for a counter-rally, or is there more downside ahead? At least for the immediate, we know that April's low of 4953 is direct support.
Market Breadth
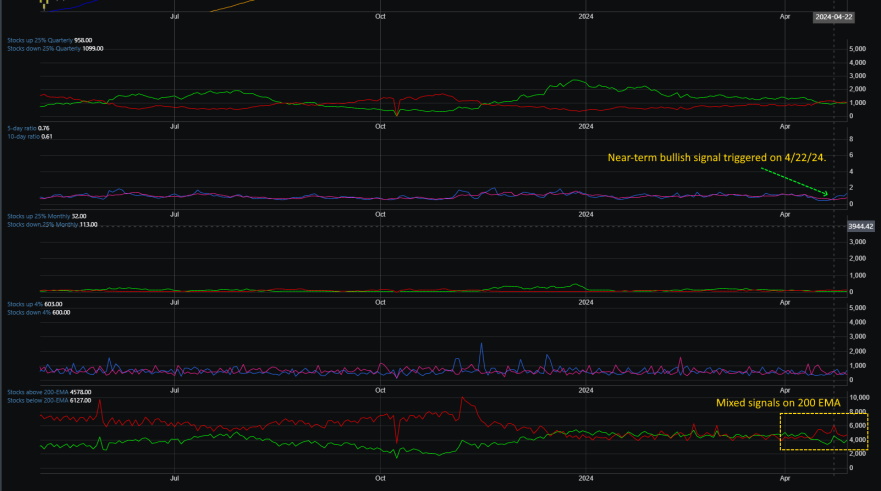
Market breadth has been reversing to the bearish side for a month now. This past week's session allowed the S&P 500 to rebound after a near 7% pullback. However, the current market breadth readings in the 25% quarterly suggest the overall strength of the stock universe is in a precarious state. We have mixed signals in the readings of stocks above 200EMA. This suggests market participants are not ready to jump back on the bull rally, and there is a higher chance that breadth could start continuing on its bearish trajectory.
Market Sentiment
Market sentiment has been greedy for most of the year. Not until last month did we start seeing sentiment slide and hit a low not seen in two years. The good news is that markets did a short counter rally when that low hit on December 12, 2022. Should we expect another this week?

Market Outlook
Market sentiment has reversed quickly over the last month, and with it, so has market direction. Now, we are seeing more bearish signals on multiple indexes. If you recall from our last blog, we were seeing early signs of weekly bearish signals, but it was only QQQ that was triggering this signal. Now, we are seeing multiple bearish signals come into play.
SPY
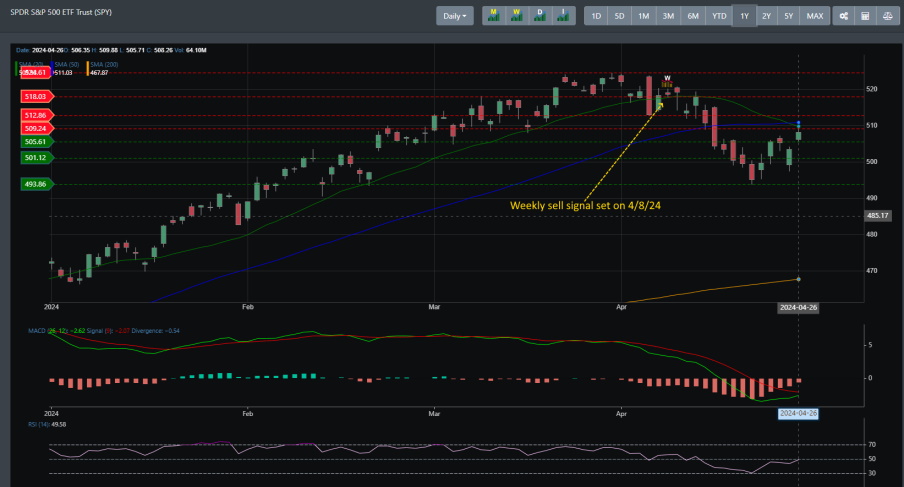
SPY has now posted its weekly bearish signal, and with that signal, several near-term support lines have been broken. The last time we received the accompanying weekly bullish signal was on October 30, 2023. Support is currently at the 493 region. There is an ongoing counter-rally.
QQQ
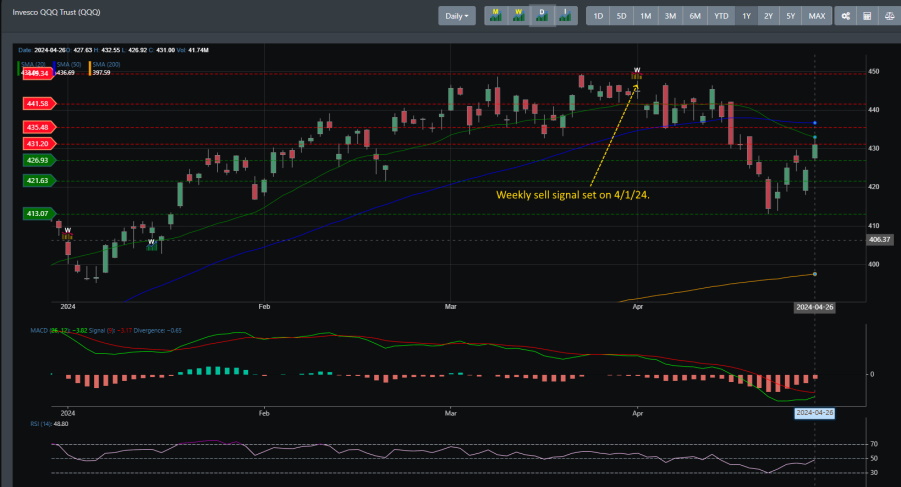
QQQ issued its weekly bearish signal back on April 1, 2024. Like SPY, it has broken several near-term support lines and now is in a counter-rally. Current support is at the 413 region.
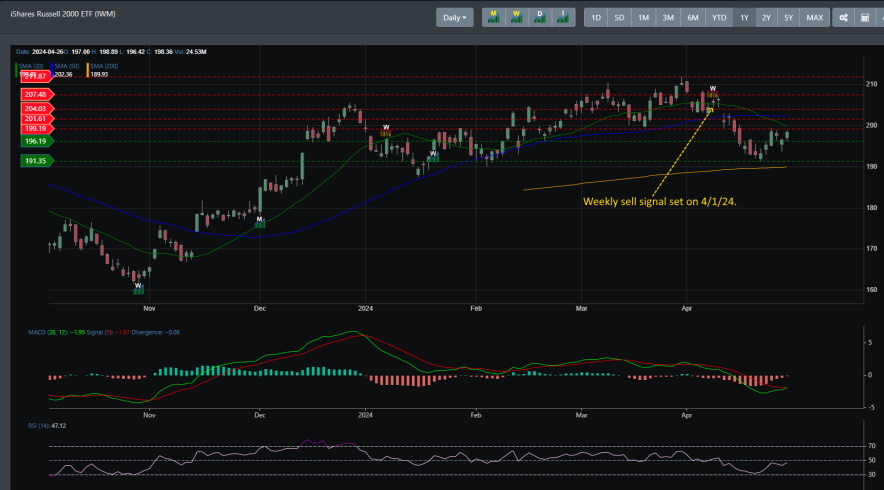
IWM
Like QQQ, IWM received a weekly bearish signal on April 1, 2024. Like the other major indices, it has broken some near-term support lines. Support is currently at 191, and a counter rally is in play.
VIX
The monthly and weekly bullish signals triggered on April 1, 2024, clearly were a vital sign of things to come for the markets. With both monthly and weekly bullish signals, there was a high probability of a market pullback.

Concluding
There is a current counter-rally occurring in the market. How much leg does this rally have? This rally looks similar to last year's rally, leading to a topping in late June of 2023. Afterward, a counter-rally started and topped off in late July 2023. With technical readings on the daily time frame being in oversold territory, there is a chance that this counter rally continues into next week. However, our internal algorithms suggest that the probability of this rally continuing to regain all-time highs is very low. The likely scenario is that the counter rally stops short of all-time highs, and the next move is lower. This means there is potential for the 4953 support region to be tested. A break of this will mean we are headed to the low end of the 4800 area.