


On Friday, Wall Street achieved its second-best weekly gain of 2025, with the S&P 500 (SP500) surging by almost 5%. On Friday, Wall Street achieved its second-best weekly gain of 2025, with the S&P 500 (SP500) surging by nearly 5%. After experiencing fluctuations on Monday, markets embarked on a four-day rally, with the bears screaming that a recession was still on the horizon. The S&P 500 closed the week up +4.5%, the technology-focused Nasdaq Composite rose by +6.5%, and the blue-chip Dow Jones Industrial Average experienced a gain of 2.5%.
The bulls are in control at the moment. But is this a Dead Cat Bounce waiting to trap them in a deeper decline?
As we stated in our last blog, "However, we are at a point where a potential bottom has been reached, and key indicators suggest that, at the very least, a near-term counter-rally is in play. SPY has rallied to hit its 50% Fibonacci levels from all-time highs, and now it looks like it will drop to somewhere on the next support at the 512 regions. If it can hold in the week or two, it is highly probable to rally back up to its 61.8% reading." Markets stabilized this week and were able to close right above support in the 5491 regions. Do we see a move to test the following resistance line, or does the Dead Cat Bounce fool investors into jumping on the bandwagon before dropping down to support?
Big Picture
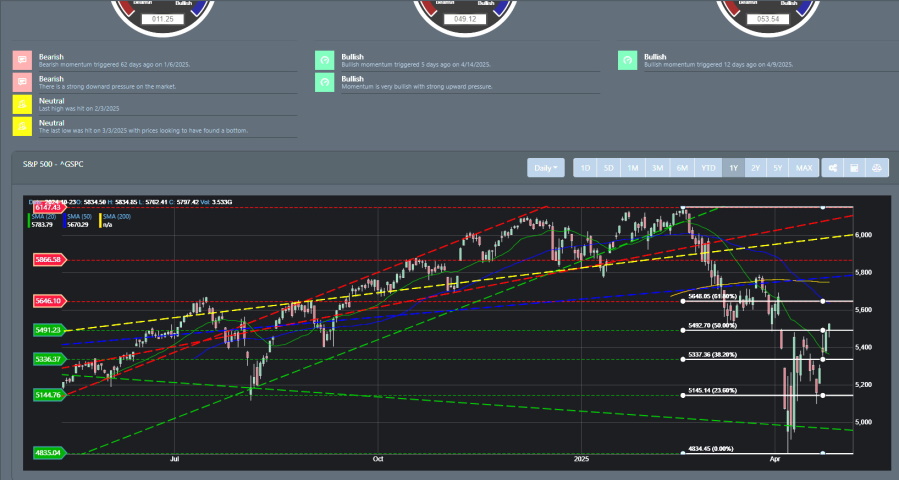
This week, the S&P 500 demonstrated a remarkable recovery, surpassing the range of the previous week, achieving a new recovery high, and closing above the March low, which may indicate the potential for a significant monthly time-frame reversal. The last few days of the week helped move the S&P 500 out of correction territory. The technical readings are not overbought, which suggests that there is still room to move.
As we can see from the image below, Bullgap's trendlines provide clear support and resistance guidelines. The average support line (green dash) coincides with the bottom struck at the 4835 regions. The S&P 500 Fibonacci levels readings (white line) show that price action bounced off support and is currently at 50% Fibonacci level. As you can see, on Monday, support was tested at the 5144 regions before markets continued their ascent upward. This is something we expected, as suggested in our last blog for Nasdaq QQQ:
"Support is currently at the 402 regions, and while I did break through to resistance earlier this week, it has trended lower to suggest that it will test the next support at 435. The bulls will need to hold support if QQQ has any chance of a reversal."
Last week, markets could not close above resistance, which indicated that they would find support at the next level down. However, the bulls came out this week to help claim support and drive up the market.
Market Breadth
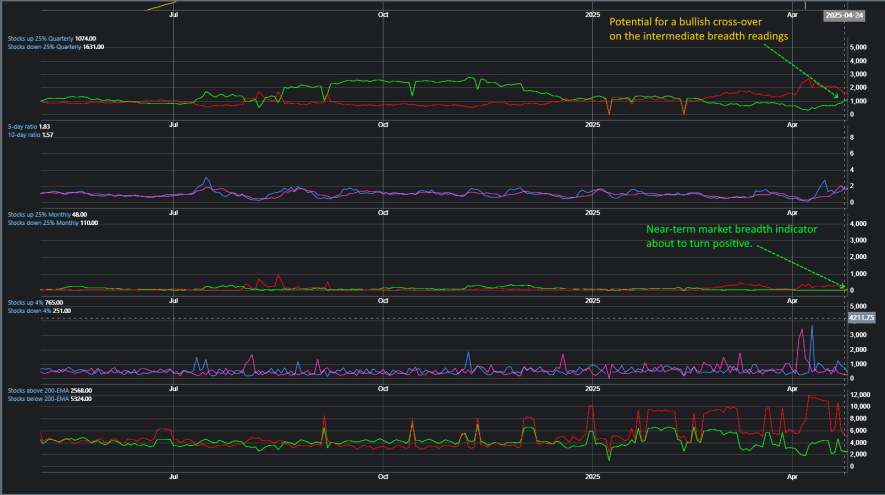
Last week, we discussed how market breadth had one of its worst readings since mid-2022. Well, what one week can do to help change some of that narrative? Though market breadth is still reading bearish, the near-term and intermediate breadth readings indicate they may turn bullish. Below, we can see that stocks up\down %4 are ready to turn positive. And the 25% quarterly reading has narrowed enough where there is potential for it to cross. If the markets continue to improve, there is a good chance that the intermediate readings will cross over, which historically has been a tailwind for investors.
Market Sentiment
Today, we look at our market sentiment reading from the weekly time frame. This gives us a bigger picture snapshot of larger scope sentiment movement. As you can see from the image below, market sentiment has some pretty low readings recently. But with this week's movements, sentiment is trending upward. Even on the weekly time frame.
Now, the weekly MACD readings suggest that sentiment is about to get bullish. All signs point to a bullish MACD crossover, which means the bulls are just getting started.

Market Outlook
This week's market activity exhibits several traditional bullish characteristics. The support level at 5144 was challenged on Monday, resulting in a low that triggered a robust rally that overshadowed the previous week's range. The market closed on Friday at the peak of the weekly range, suggesting that the upward momentum is expected to persist.
SPY
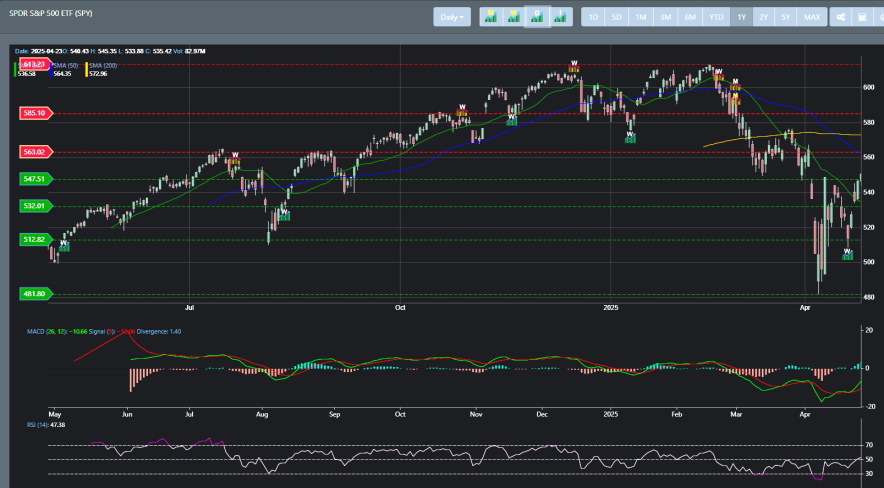
SPY is beginning to change course from bearish to bullish. SPY closed out the week with a weekly bullish buy signal. Though the monthly bearish signal is still intact, the weekly buy signal is helping to push prices higher. SPY closed this week right on support at the 547 region. It now has a chance to challenge resistance at the 563 region.
QQQ
Like SPY, QQQ also received its weekly buy signal to close out the week. It closed out the week right above support at the 471 region. It is poised to move higher to its 61.8 Fibonacci level, which is right at the 487 region.

IWM
Even IWM had its weekly buy signal trigger this week. Price action has taken them well above support at the 189 region. IWM has a high probability of attempting to challenge resistance at the 199 resistance band, but this may take some time. Price action last year has been mostly range-bound. With its bearish trend hitting late the previous year, IWM will need time to attack resistance at the 199 region.

Concluding
The S&P 500 has experienced three successive days of substantial gains, regaining all losses from the previous week and exiting correction territory, suggesting that the lowest points of this significant decline may be behind us. The bulls are in complete control, with several major indexes signaling a weekly buy signal. The expectation is that markets will move higher into the coming weeks to where they will challenge their following resistance line - right up to their respective 61.8% Fibonacci levels. If markets can hit the 61.8% Fibonacci level, there is a high probability for markets to do a reversal to stabilize the overbought conditions.