


We are now well into half of 2024, and the S&P 500 is up +17% for the year. While investors were looking for rate cuts earlier this year, nothing has yet to materialize. This has not phased investors, as markets have been in an uptrend rally buoyed by the AI bullish backdrop. That said, as we noted in our last blog, market dynamics are now approaching a weighted consensus where everyone is bullish. This overweighted bullishness is now showing signs of a topping or pullback forming.
As noted in our last blog, "Though the technical readings are highly favorable and bull rallies can generally keep technical readings highly overextended, a pullback would allow markets to relieve the technical overbought conditions and continue higher. The potential for this becomes higher as we approach late July or August as our core analytical algorithms are already turning bearish."
Even with investors pricing in a September rate cut, the S&P and Nasdaq are showing signs of being highly overbought, with resistance pushing pricing down.
Big Picture
Friday closed with both the S&P 500 and Nasdaq 100 closing right above their near-term support. The S&P 500 closed this Friday right above support at 5505. The Nasdaq closed right above resistance as well but is now down more than -4.5% from its all-time high. IWM, which was having a breakout through several key resistances, is now turning over and looks to follow suit.
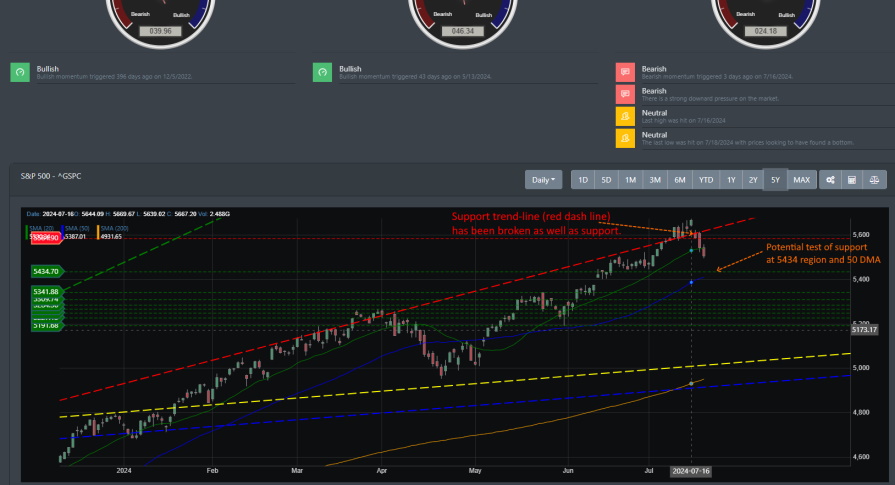
Looking at our chart below of the S&P500, near-term support has been broken, and now we are looking at a high potential that price action will take us into the next support line around the 5434 region.
Market Breadth
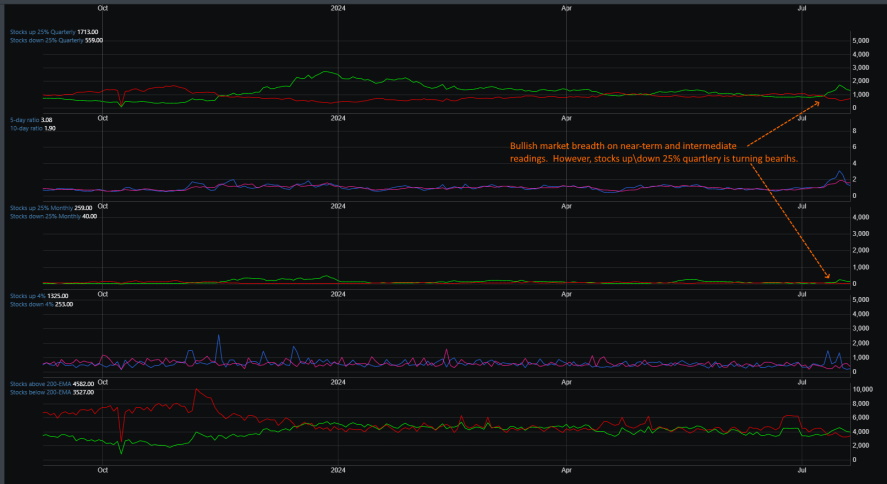
In early July, market breadth started to turn the corner. With our near-term and intermediate market breadth signals triggering a bullish reading on July 10, markets continued their rally higher. However, we are now seeing a change in our near-term readings with the 5 to 10-day ratio of stocks bullish and bearish, moving into a bearish trend. While a core of the fundamental breadth readings are now positive, the near-term signals indicate that a reversal may be coming. Sooner rather than later.
Market Sentiment
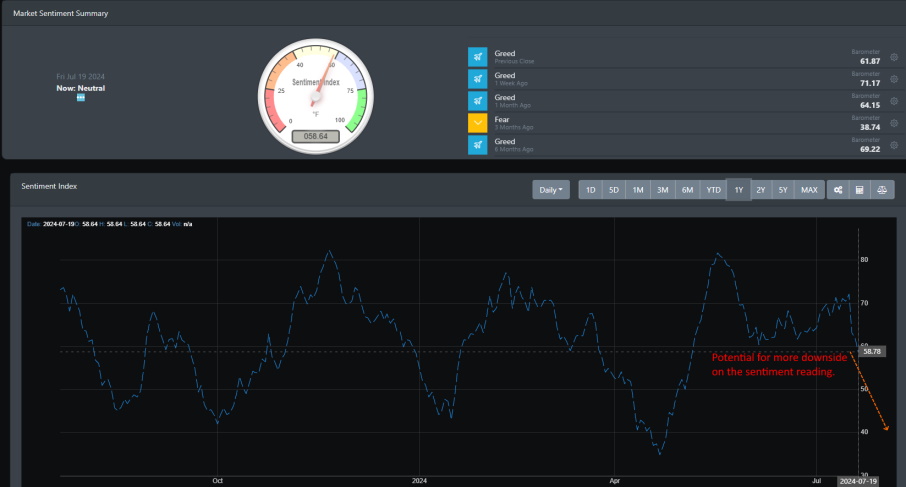
Bullgap's market sentiment readings have been bullish for the past few months. While the chart below suggests strong support near the 58 region, the weekly sentiment reading indicates more potential for investors to turn bearish in the near term.
Market Outlook
The week ending on July 12 saw some cracks in the markets. This week's price action now spells out a pullback if no topping exists. The outlook of both SPY and QQQ closing positive for July could indicate more downward price action. June's trend line, as shown in the Big Picture section, has been broken, and this points to price action testing the 50DMA or support at the 5434 region in the very near term. There is a high probability that we will see this tested next week or the following week.
SPY
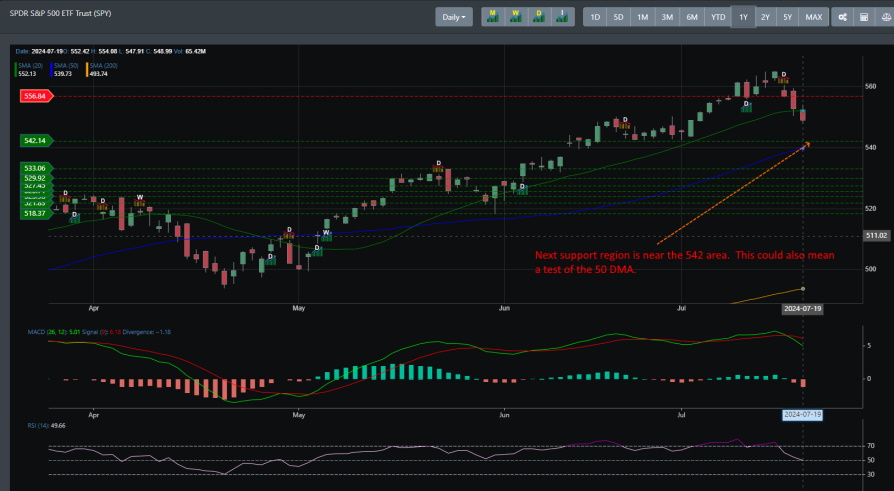
SPY has been in a strong uptrend for most of the year. With a weekly buy signal triggered on May 06, 24, it has rallied to all-time highs. However, after breaking through resistance to make all-time highs, it has now broken through that support, and now we are looking at SPY potentially challenging the next support at the 542 region.
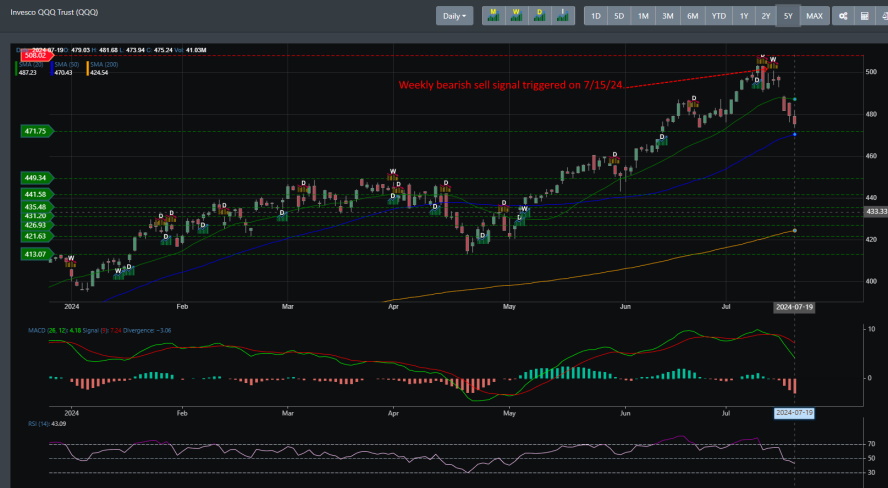
QQQ
Not so surprisingly, Nasdaq QQQ received its weekly sell signal on 7/15/23. With this sell signal, QQQ has a long way downward but is looking at a high probability that it, too, will test its next support at the 471 region. After being the darling of the rally for much of 2024, this pullback from QQQ is not surprising. The major upside has been reached, with the 1.618 Fibonacci levels holding up as resistance near the 508 region.
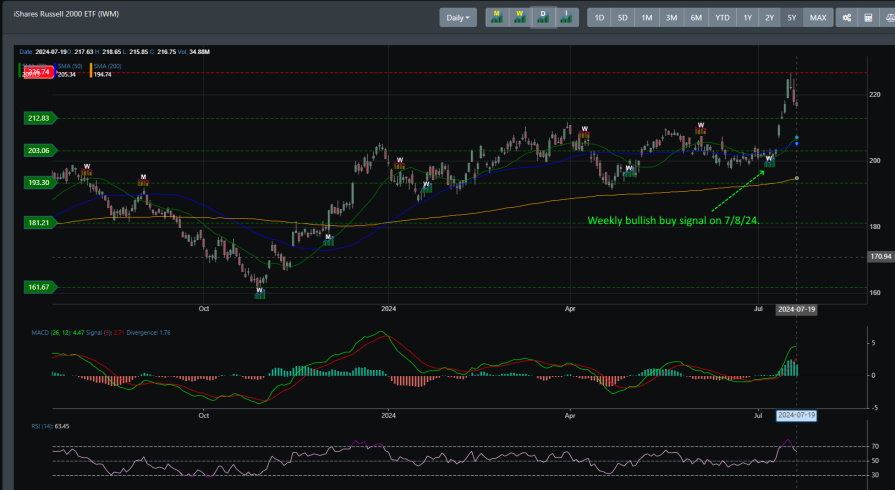
IWM
IWM had a +11% surge in under five days. After meandering with price action between the 193 and 212, where attempts to break through to the 212 resistance line have failed on several occasions this year, IWM broke through convincingly to get stopped by the 226 resistance line. With such rapid price action, the failure to break out through the 226 resistance is not surprising. The last time we saw rapid price movement in IWM was in December when price gain increased by more than +25%. If IWM can hold onto support now at 212, it has a chance to continue its rally.
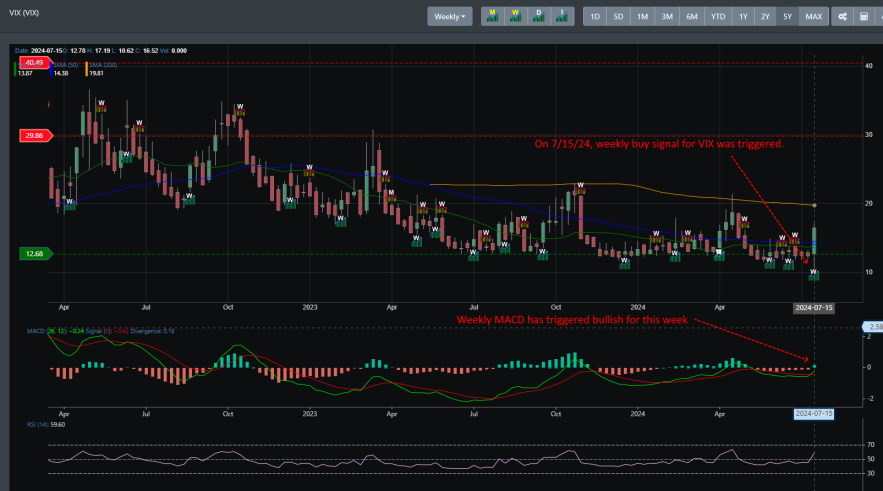
VIX
After remaining near sub-13 readings for most of the year, we see a potential for VIX to move higher this week. Looking at VIX from the weekly time frame, we now see a MACD cross-over that coincides with the weekly bullish signal set on 7/15/24. If you look at instances this year where the weekly MACD turned positive with an accompanying weekly bullish signal, markets typically decline afterward. You can see this on 1/29, 4/1, and now 7/15.
Concluding
The word for this coming week is caution. Now is the time to not be so bullish and wait to see how market price action will play out. Major supports on multiple indexes have been broken this week, and market breadth is looking to turn bearish. We are likely that price action will continue downward until support is met near the 50 DMA for the S&P500 and Nasdaq 100. We have already received a weekly sell signal on the Nasdaq, and there is a high potential that the S&P 500 will receive one if price action continues in this fashion.