Using Artificial Intelligence with Deep Learning, RallyPoint provides a powerful yet easy-to-use tool for identifying market trends and patterns for the stock market.
RallyPoint
RallyPoint is a machine learning and deep learning platform that gathers enormous amounts of market and financial data, organize\aggregates those data and uses algorithms to train and test the data to determine the outcome result.
Gather and Process Data
We have stockpiled enormous amounts of market and financial data from the market and we are still gathering data on a daily basis.
Data Prep
Having all that data means nothing if we cannot aggregate, organize, and prepare the data for use in our deep learning models and complex algorithms. Historical pricing data, technical indicators, market sentiment readings, news, and social feeds are all aggregated to build a data pipeline to be used by our AI\ML engine.
Machine Learning Models
We have built machine learning models to assist in identifying and recognizing patterns in the market. From automatic trendlines, candlestick chart pattern recognition to Elliott wave patterns, our models have been hand-built and optimized for
Neural Network Models for Deep Learning Tasks
We have optimized neural networks with predictive models setup to provide 1-day, 5-day, 15 days to the 30-day forecast of a major stock market index. Monthly trend forecast for all U.S assets.
Testing and Validation
Leveraging our data-prep pipeline, we feed the data pipeline to fit the model and split out appropriate test data to validate the predictive result set.
Rally Point Models
| Rally Point Feature Models | Description |
| Stock Market forecasting V1 | Neural network model that performs a market forecast of major stock indexes for 1-day to 30-day monthly predictions. Version 1 |
| Stock Market forecasting V2 | Neural network model that performs a market forecast of major stock indexes for 1-day to 30-day monthly predictions. Version 2 |
| Candlestick Pattern Recognition | A machine learning model that identify bullish and bearish candlesticks on any timeframe for any asset in the U.S stock market. |
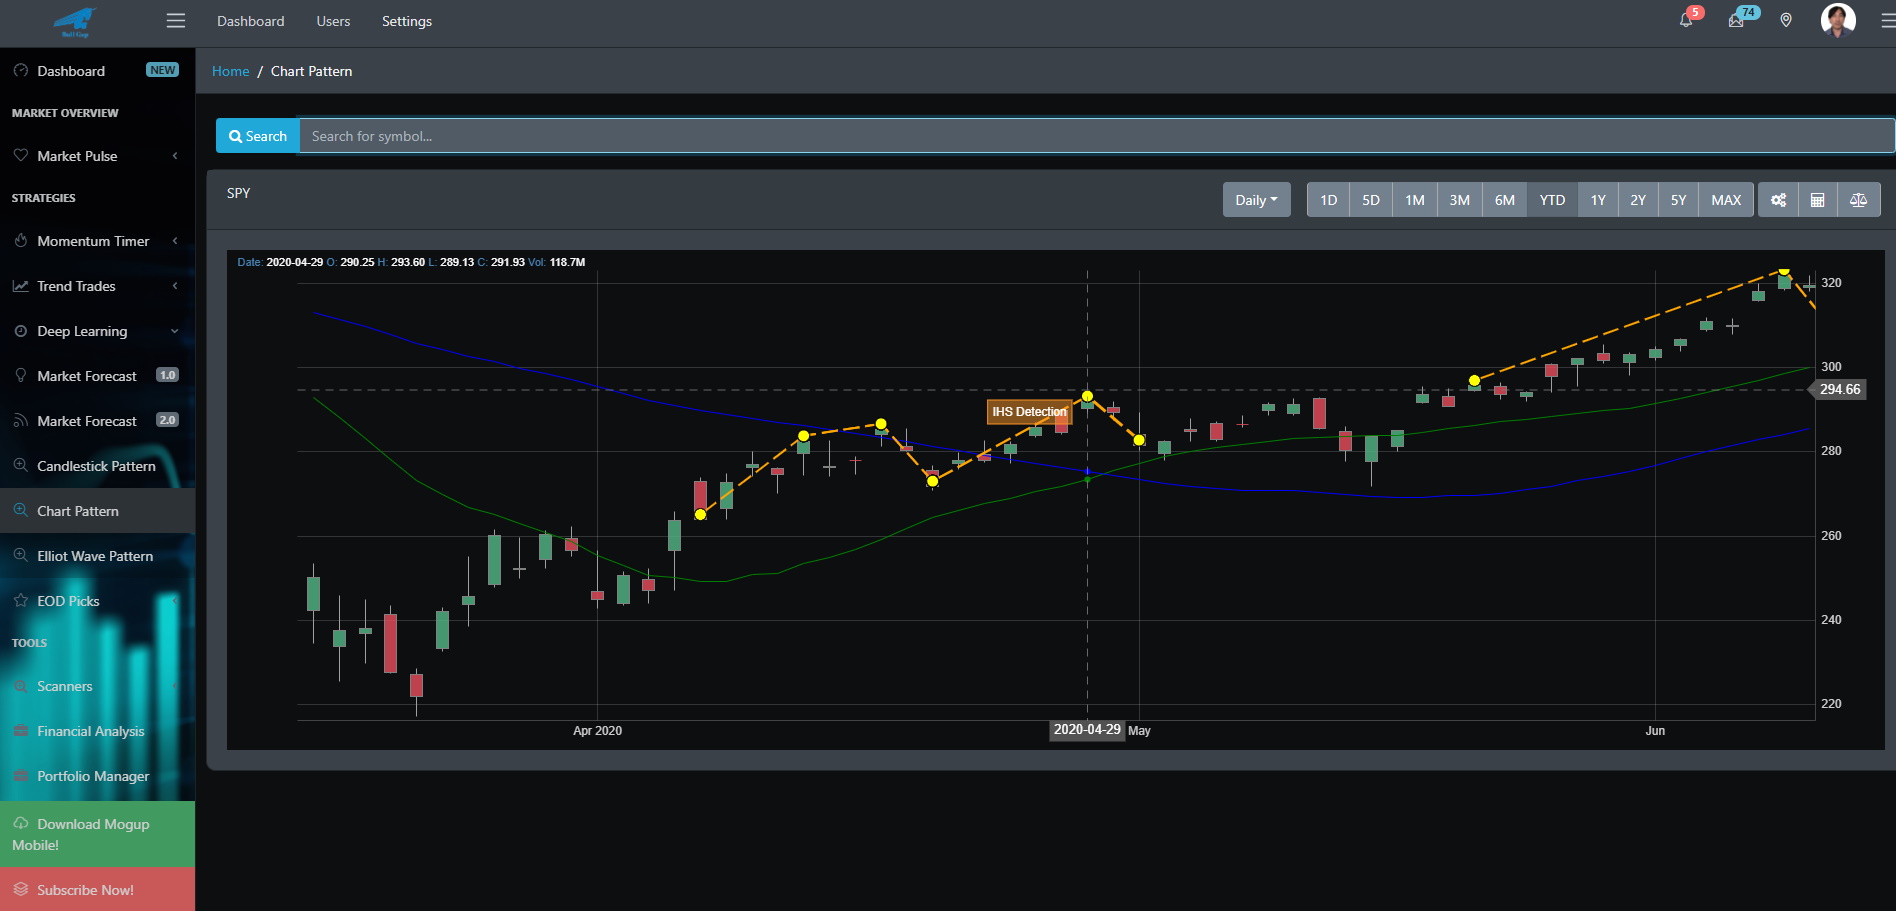
| Chart Pattern Recognition | A machine learning model that identifies various chart patterns such as Head and shoulder, Inverse head and shoulder, etc. |
| ElliotWave Pattern Recognition | Identifies various Elliott wave patterns such as zig-zag, impulse, double, diagonal, etc. |
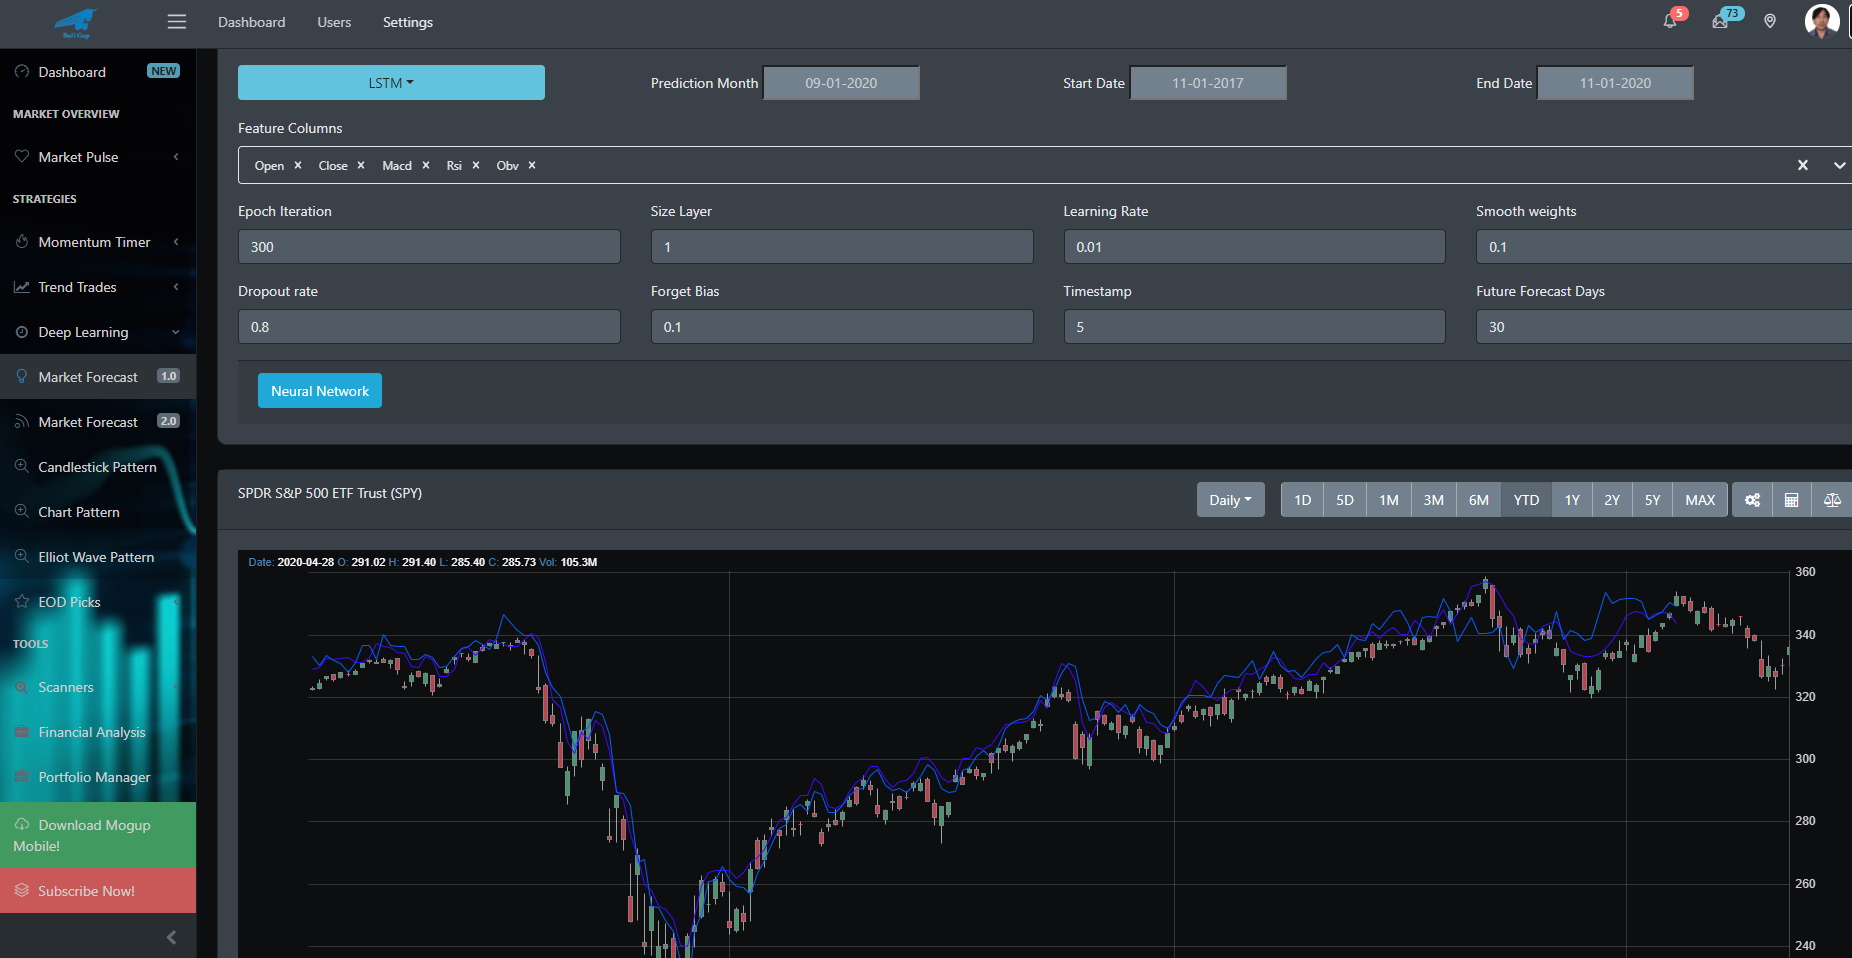
Market Forecasting model
The market forecasting model predicts all major indexes for the U.S market from 1-day to 30 trading days. Users are able to select various prediction models to review the forecast trend lines for the market.

Candlestick Pattern Recognition
For any ticker symbol in the U.S market, you will be able to get over 60+ candlestick recognition in any time-frame. Each candlestick pattern is not only recognized but the best candle pattern is mapped with bullish or bearish indicator.
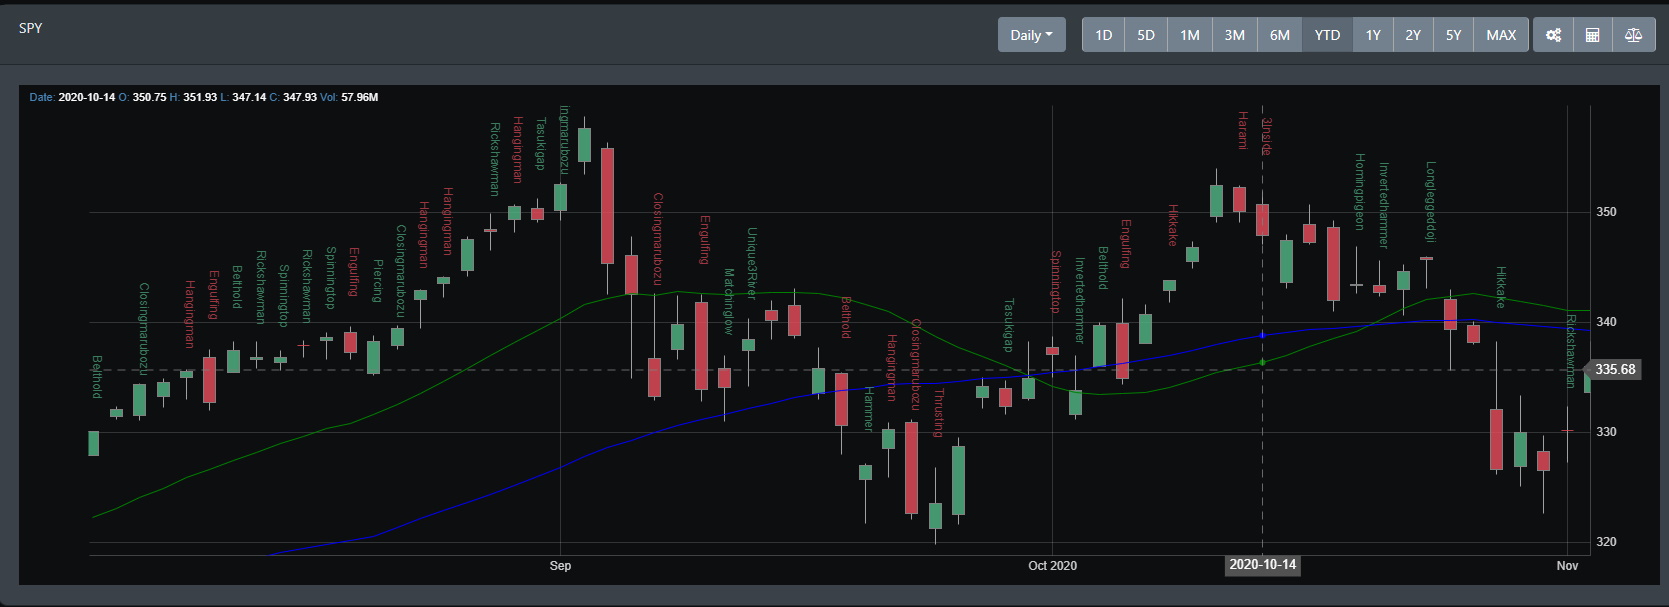
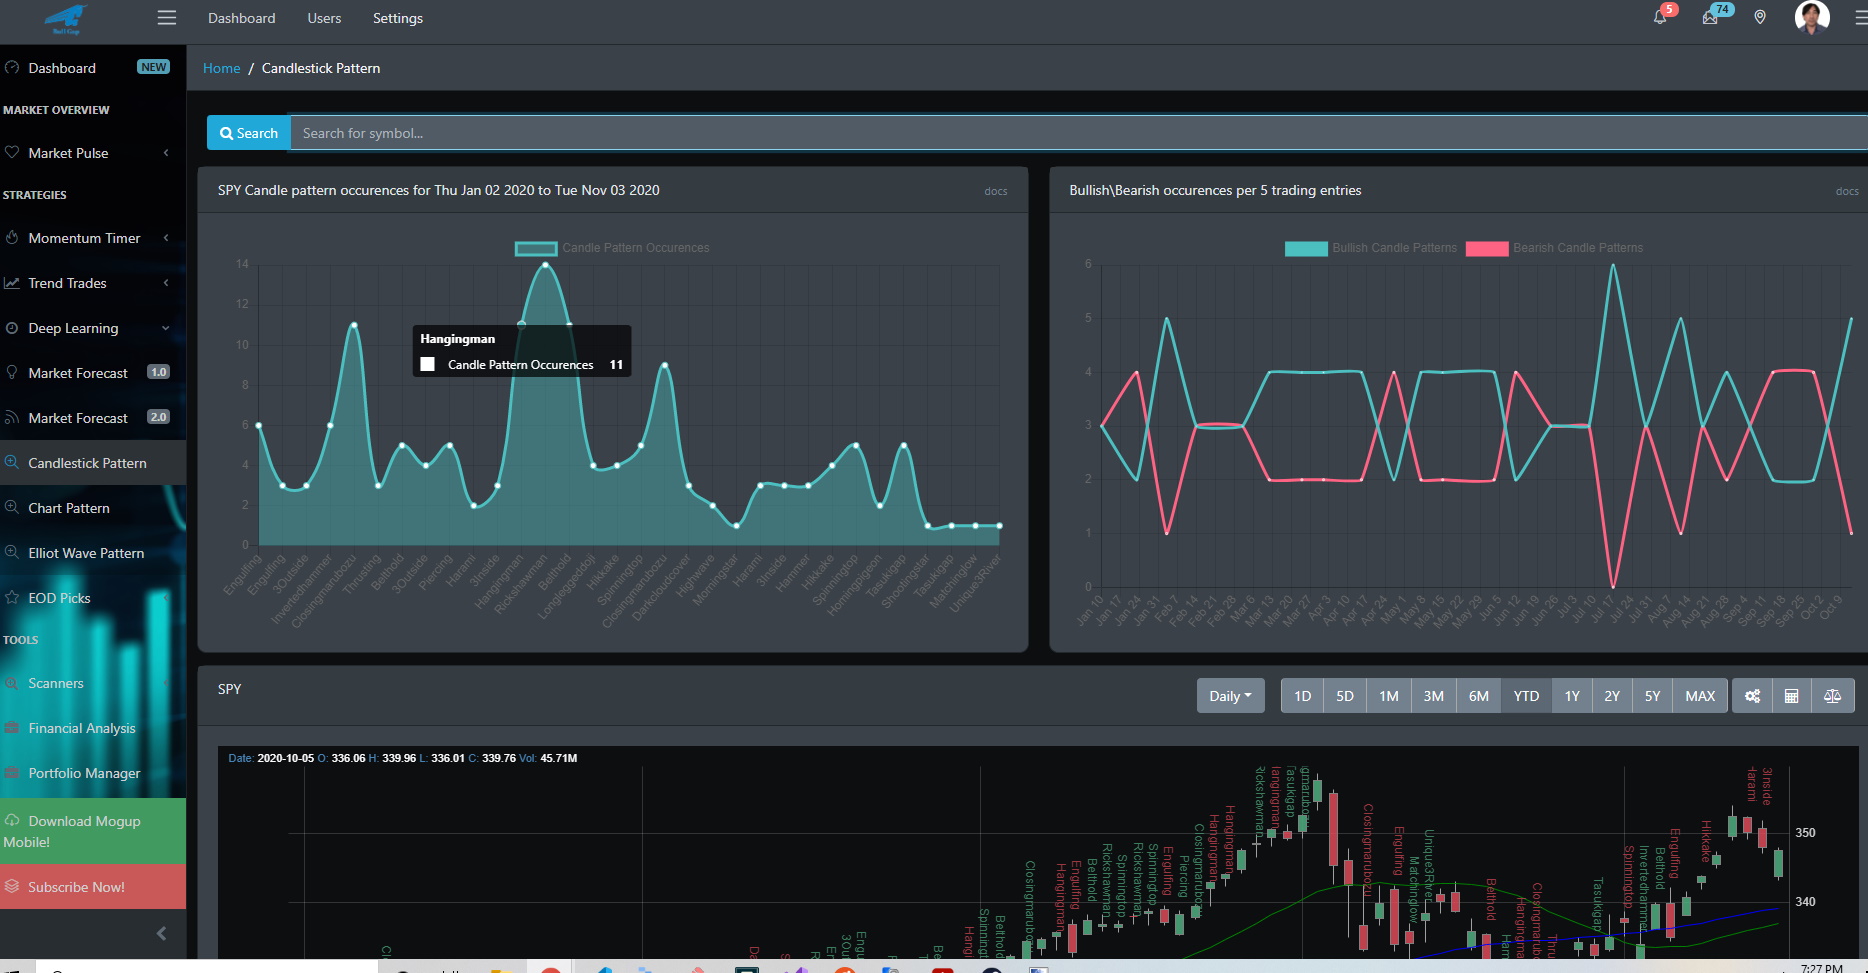
Chart Pattern Recognition
Chart Pattern recognition that gives you pattern identification for various chart patterns such as Head and Shoulder, Inverse Head and Shoulder, broadening top, broadening bottom, triangle top, rectangle top, etc.
Elliott Wave Recognition
The Elliott wave recognition model identifies various Elliott wave patterns in any time frame. Elliot wave supported are Impulse, Leading Diagonal, Diagonal, Zig-zag, flat, double zig-zag, expanding triangle, etc.

