September blues are here for the U.S markets. For four consecutive weeks, the S&P 500 has closed in the negative. The Nasdaq 100 posted +1.11% for this week but was posting three straight weeks of decline since then. As discussed in our last blog, this looks to be a textbook technical decline. Though, it does not discount the fact that the streak of weekly declines is the longest we have seen for both indexes in some time. It has been 13 months since the Nasdaq has posted 3 weekly consecutive declines. For the S&P 500, it has been 11 months since it has seen a 4-week consecutive decline.
If we look at the global market for last week, we can see a global pullback occurring in the market. The stock market weakness is showing up in September for global markets. The average global stock market is below its 50 DMA. This is definitely a month to forget for the Bulls.
The Big Picture
Since charting new record highs from August and into early September, the S&P 500 has fallen nearly 10%. Could this indicate the start of a new bear market or is the current equity market experiencing a correction? A major downturn in equities usually correlates to high market volatility that is typically news-driven. That was such the case in early Spring when CVOID-19 hit the global economies. As we discussed in our prior blogs, a euphoric sentiment with a taste of FOMO and technical readings that implied earning expectations for mega-cap companies were just a little too high. With September being historically the worst performing month, technical readings in overbought territory, and trading occurring in the 3 to 4x standard deviation, there was bound to be a correction coming.
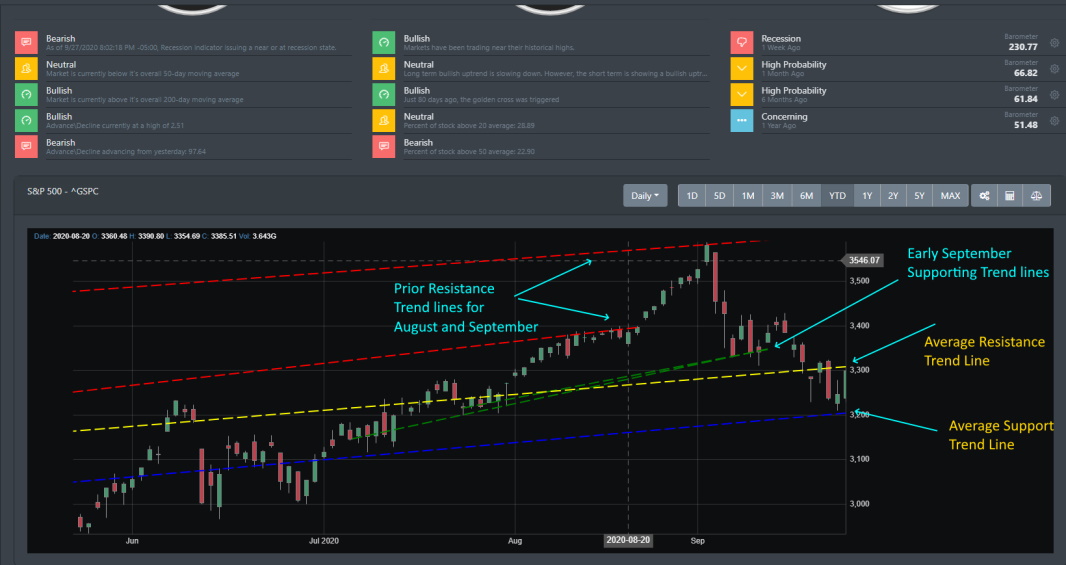
If you look at the Big Picture view below from MogulUp, you can see the trend lines generated for the S&P 500. In mid-September, the S&P 500 broke through the green supporting trend line. This caused it to drop right down to what our algorithm calls the Average support line for the S&P 500. Last Friday's rally was not enough to help push the market out of the downtrend.
Market breadth is reading bearish with only 22.9% of stocks above their 50 DMA. Only 28.89% of stock participants are above their 20 DMA.
Economic Outlook
The economic readings are loaded for this calendar month. The last official employment report comes out right before the election. While the economic data continues to show improvements, the employment numbers remain suspect.
The good news
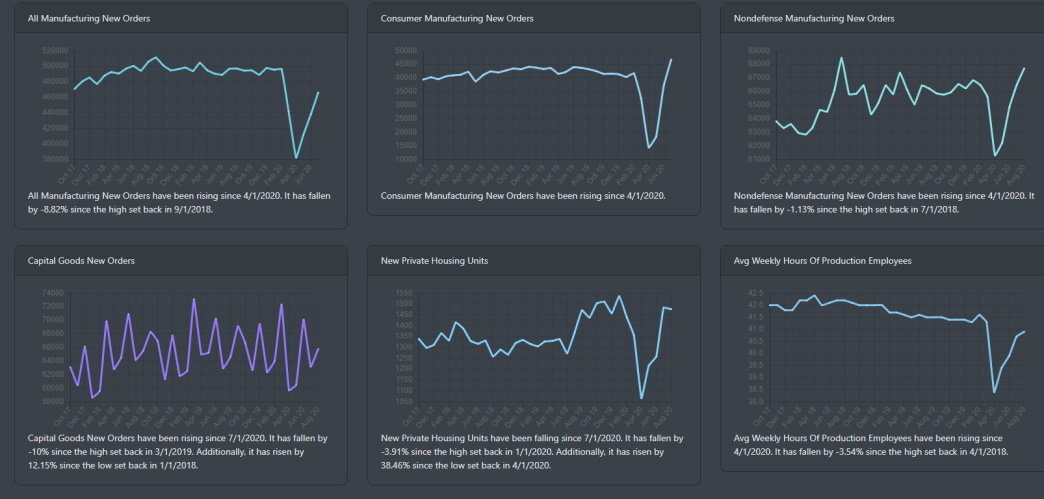
If we look at the visual data below, new manufacturing orders, new orders in private sectors and the housing market are literally making a V-shape recovery. Durable goods are on the rise and have been trending up for the past four consecutive months. Excluding transportation, new orders have increased by 0.4 percent. Excluding defense, new orders increased by 0.7 percent. Machinery has also been up for four consecutive months. Non-defense capital goods are also on the rise.
Now, the bad news
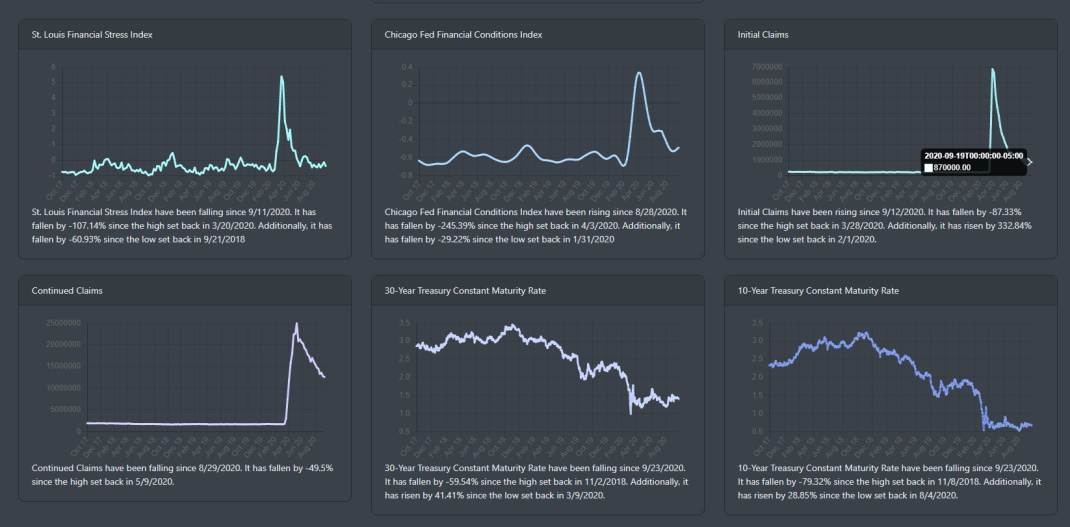
The initial jobless claims increased from 866K to 870K from last week. The reading was off from the expected 825K. Continued claims are dropping but still at historically elevated highs. The job rebound is losing steam and looks to be slowing down. If we compare this to the pre-COVID era, the number of individuals filing for state unemployment is historically high.
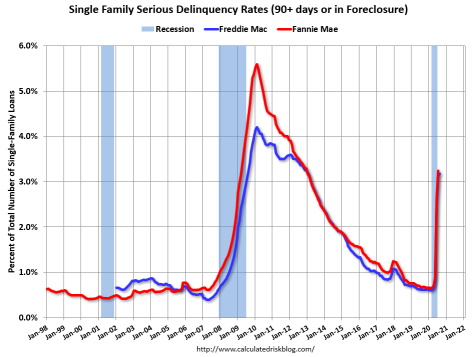
Additionally, according to Freddie Mac, the Mortgage serious delinquency rate has increased. The reading in August is at 3.17% and is the highest reading since January 2013.
Mortgage Delinquency on the rise
Market readings
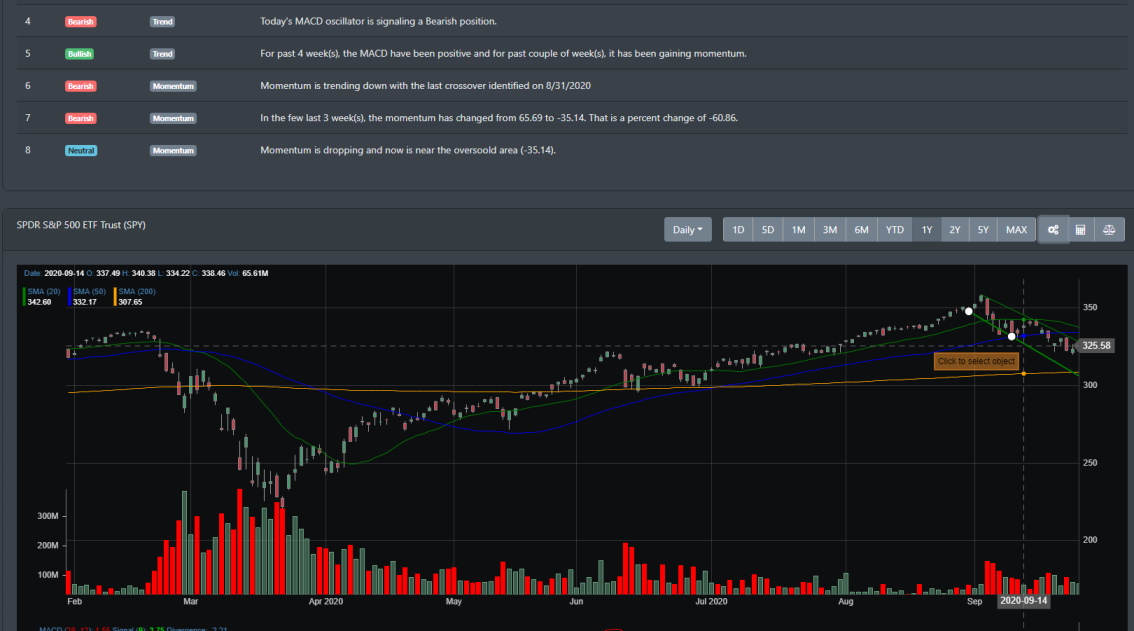
Looking at the daily chart for SPY, this has the look of an "orderly" and textbook technical correction. We are clearly in a downtrend but there is no panic sell-off. Volume has been low during the decline. As discussed in our earlier blogs, the market was trading at a 3 to 4x standard deviation. It is now at the upper level of the 2-standard deviation range. Another item to note is that the volatility index did not have a sharp rise during this drop-off. Another confirmation that this is just part of a healthy market correction.
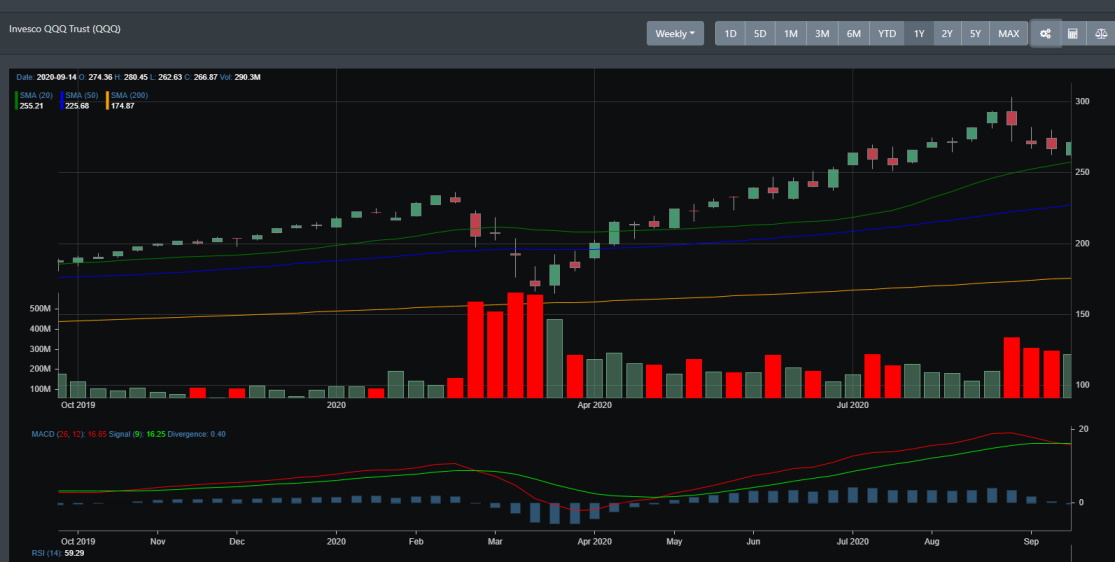
QQQ Weekly chart
If we look at QQQ (ETF for Nasdaq) on the weekly chart, the MACD oscillator triggered a sell signal for last week. Even with the market rally on Friday, QQQ is currently trading below its 50 DMA. As discussed earlier in this blog, the number of stocks trading above their 200 DMA, 50 DMA, and 20 DMA is declining.
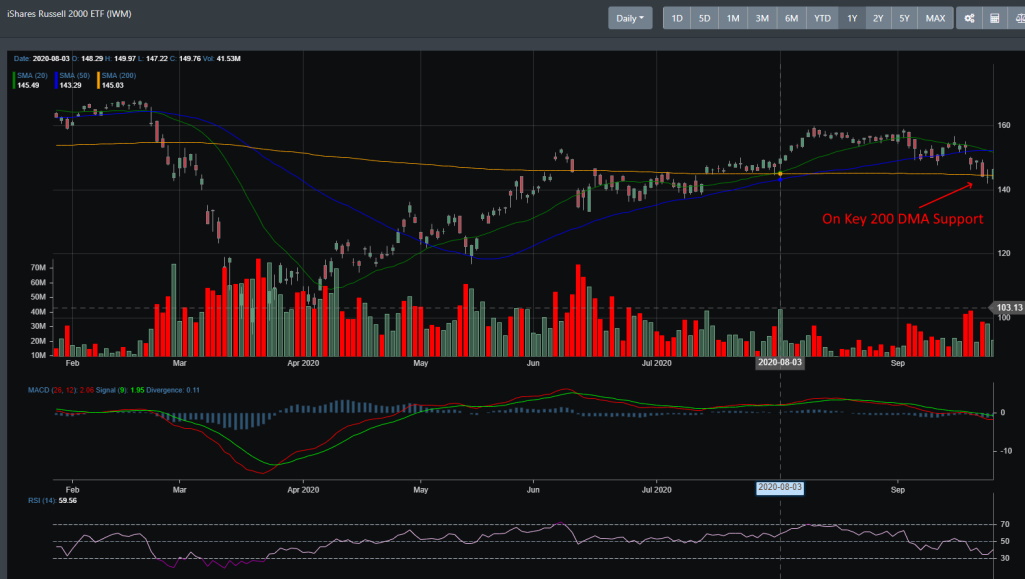
IWM Daily chart
Small caps had a sharp drop off earlier in the week and rebounded modestly. It is currently at a key support level. The 200 DMA. The concerning part is that volume has increased during this time which indicates an increase in selling pressure.
Conclusion
Will the market decline continue next week? Currently, the market has rallied back to the previous consolidation lows. If the market can rally back above the 50 DMA, it is possible that it could back above the 20-DMA. However, that may be asking a lot. Even with the U.S central bank flooding the market with liquidity, you can see that small caps (small to medium businesses\non-public companies) are taking a beating. While the Feds can calm and support the public markets by providing an ample amount of credit, small and medium businesses typically do not have access to this credit. This large pool of non-public companies is facing collapse and near "out-of-business" signs. Given that the economic state is still in a recession, earnings remain week, technical readings are still in the sell signal, a deeper correction may still be in the months ahead.


