All major indices dropped last month. Prior to that, we saw a risk-off trading environment that allowed mega-cap tech stocks to soar to all-time highs. Then September came along and all major indices fell sharply over the following consecutive weeks. The S&P 500 was at one point trading below 10%...
Blog
September blues are here for the U.S markets. For four consecutive weeks, the S&P 500 has closed in the negative. The Nasdaq 100 posted +1.11% for this week but was posting three straight weeks of decline since then. As discussed in our last blog, this looks to be a textbook technical decline. T...
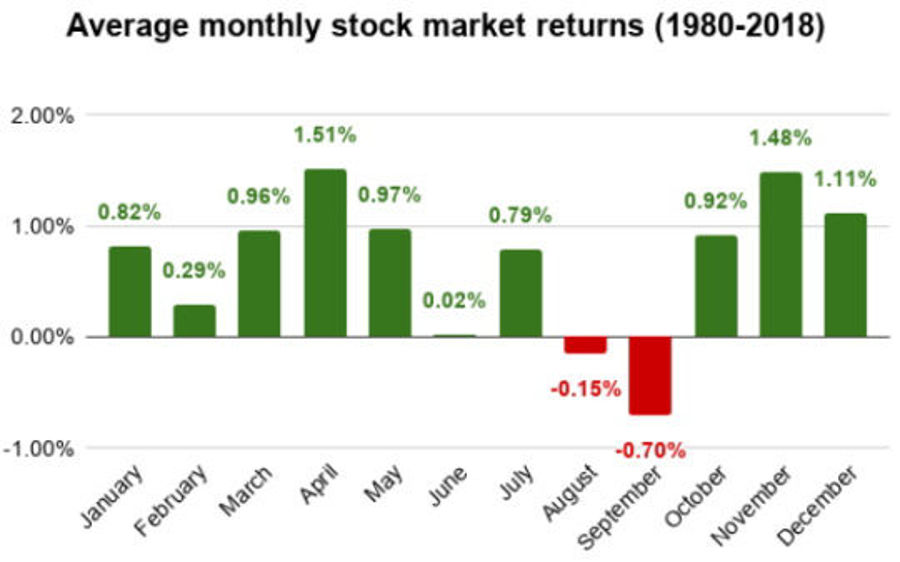
September blues are here. Since 1950, September has been on average the worst-performing month for the U.S markets. Major indices such as the S&P 500 typically decline by 1% in September. This month alone, the S&P 500 has declined by -5 percent. The Nasdaq leads the decline by -8 percent. The D...
is what the market looks like it is doing. In some of our previous blogs, we looked at the economic data with MogulUp's fundamental data analysis. Though there are areas where the economic data shows a V-shape improvement (pre-COVID 19 levels), the initial unemployment claims data that came out on...
or more like after reaching overbought levels. Though August 2020 certainly ended with all major indexes hitting all-time highs, September started off with a drop late last week. Last week on Tuesday and Wednesday, Wall street was reigning in with optimism. Then heavy selling pressure (high volum...
Sell In May and Go away
So, the saying "Sell in May and go away" really did not apply for the Summer of 2020. Markets in July and June saw all-time highs for all major indices. And August was no different.
Historically, the monthly returns on the S&P 500 for August are usually low. In fact, w...
Just a correction from February 19, 2020 market plunge. Or was this the shortest bear market in U.S history? In a market downturn, it is easy to switch on the panic button and visualize your investment dropping and whipping out your retirement plans. But what is important is to understand what is...
to all-time highs...
With all the uncertainty with the global pandemic, U.S-China tensions, social unrest, and unemployment benefits expiration, the S&P 500 is already posting positive returns for investors in six of the last seven weeks. Since its low on March 23, 2020, the S&P 500 is now up 50...
Look who just joined the party!
On August 6, 2020, the Dow Jones formed the "Golden Cross" when it's 50-day moving average (DMA) broke above its 200 DMA. It now joins the S&P 500 and NASDAQ. As most investors are keen to believe, this traditionally signals a bullish trend. The DOW has not post...
Wrapping with July
and it looks like the stock market is still in favor of the Bulls. If only so slightly. There were many in the media who were ominous about a coming correction after the second-quarter gain in the S&P 500. For this month alone, the S&P 500, Nasdaq Composite and Russell 200...
- 2025
- 2024
- 2023
- 2022
- 2021
- 2020
- 2019


