This week, the S&P 500 experienced a death cross, a technical pattern characterized by the 50-day moving average falling below the 200-day moving average. The index is now in a downtrend and can be defined as a correction in the market. With all-time highs recorded back on February 19, 2025, the S&P 500 has dropped -14%. While market pundits will point to fears of stagflation that caused the current market condition, the reality is that the current upward trend that began in October 2022 caused excess speculative buying and overbought conditions.
The correction that started in mid-February and late March indicates a healthy market. Excessive speculative buying has fueled this rally, which began in October 2022, and now markets are trying to find their footing. When Trump announced "Liberation Day," he did not do any favors, which caused a knee-jerk reaction that saw markets drop deeper that day. However, as you will have noted, markets have recovered most of the losses following the announcement of "Liberation Day." So, where are we at now with the markets? Is this the end of the bull market?
Big Picture
The S&P 500 was making all-time highs only a few months ago, and the Nasdaq was not far behind. With the current landscape, all-time highs seem like a distant memory as investors are waiting for what will happen after the tariff reprieve. The ambiguity surrounding monetary policy impacts the markets similarly to the uncertainty regarding tariffs. This past week, markets were able to reverse course and recover some of their initial shock from "Liberation Day".
In other markets, the fluctuations in 30-year bonds were the most significant since the 1980s, gold (GLD) experienced a substantial increase, and the US dollar (DXY) fell to its lowest level in three years.
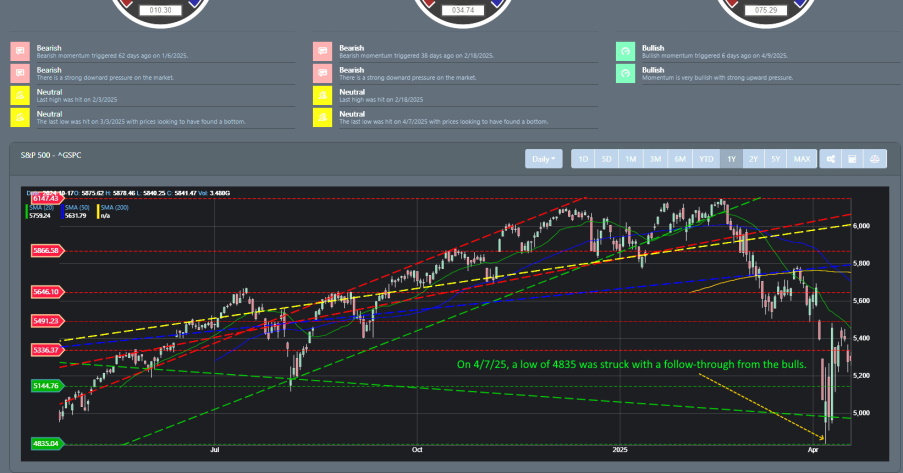
However, does the market's knee-jerk reaction indicate that a bottom has formed? With the death cross-over triggered, are we just waiting for another leg down? On April 7, 2025, the S&P 500 hit a low of 4835. If the S&P 500 reaches 4818, it would officially enter a bear market, having experienced a decline exceeding 20%.
The primary support level is the peak of 4818 reached in 2022, coinciding with the 50% retracement of the rally from 2022 to 2025. 5491 is the next resistance level; failing to break above this could mean a move lower to 4835.
Market Breadth
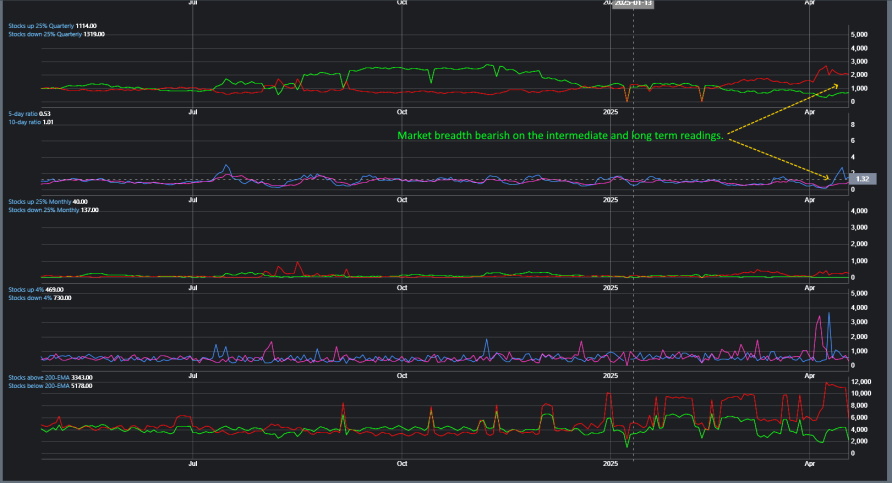
Market breadth has inverted to the bearish side since February 2, 2025. You can see that through the lens of our stock's up and down 25% quarterly reading. Additionally, the start of April kicked an uptick in bearish readings across markets, evident in major indices dropping into their recent lows. The 25% quarterly reading has not been this bearish since mid-2022 during the inflation correction of 2022. Could this bearish reading in market breadth continue? During the mid-2022 market's breadth of bearish height, markets started to subside and stabilize before giving way to the bull run, which began in October 2022.
Market Sentiment
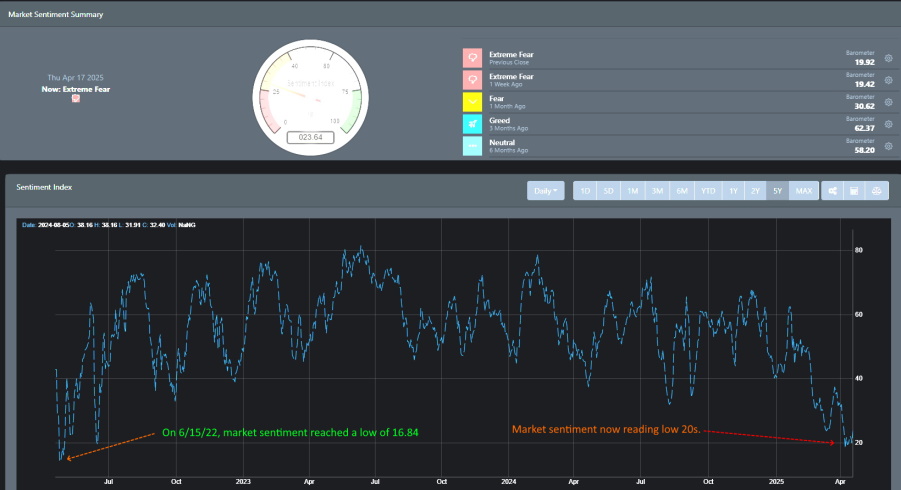
The continuous reports regarding the impact of tariffs on American businesses and consumers have been unyielding over the last fortnight, resulting in a significant decline in sentiment among consumers, businesses, and investors. Market sentiment has one of the lowest readings in the past few years. We must look back on June 15, 2022, for a much lower reading. That reading backing on June 15, 2022, coincides with our market breadth metrics' highly elevated bearish reading.
Market Outlook
With the potential for a low to be struck this month of April, there has been quite a bit of volatility in the markets. Investors are fearful, as indicated by our market sentiment readings. This fear in the marketplace has certainly caused recent volatility as investors decide whether to jump or jump out of the markets. We can see this spell out on April 9, when the S&P 500 had a +9% gain on April 14 and then dropped back to the mid-5100 readings. And if we look at the intraday play that same week, the S&P 500 had price volatility dating back to December 24, 2018.
SPY
SPY is in a clear downtrend. The monthly bearish signal was triggered on March 3, 2025, and the weekly bearish signal was triggered on February 2, 2024. Historically, it has been a strong indicator that markets were about to drop. A prior weekly bearish signal was also triggered on December 16, 2024, when the SPY closed out at 604.29. The latest weekly bearish signal that triggered close out below that reading and historically, means that markets have reached a high point.

QQQ
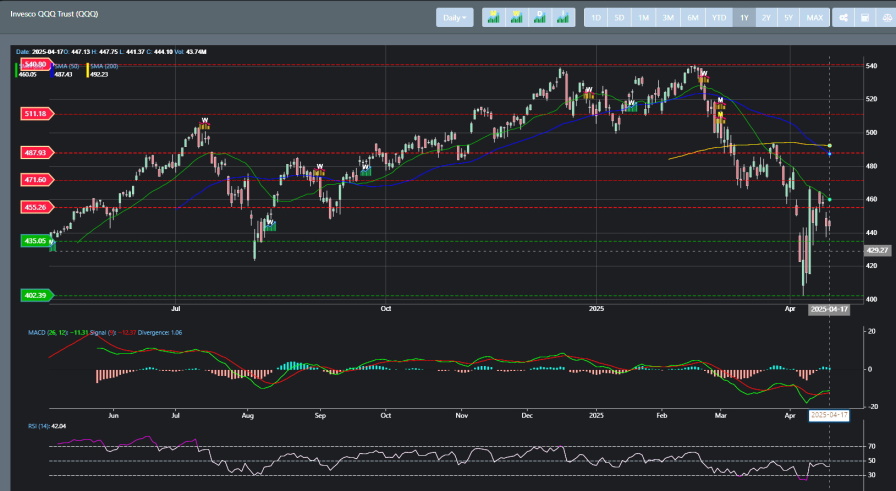
Like SPY, QQQ is in a clear downtrend, with the monthly and weekly signals triggering a sell reading in the later part of Q1. Support is currently at the 402 regions, and while I did break through to resistance earlier this week, it has trended lower to suggest that it will test the next support at 435. The bulls will need to hold support if QQQ has any chance of a reversal.
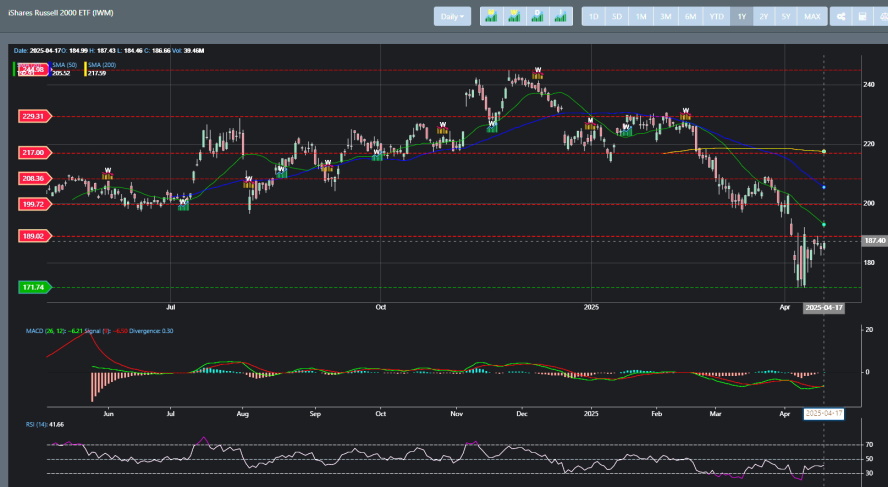
IWM
IWM has been in bearish territory since reaching all-time highs in December 2024. However, with a weekly and monthly sell signal triggering within 30 days to start the year, it was clear that the technical readings suggested market sentiment was topping out. Additionally, we can see that the last weekly bearish signal triggered on February 18, 2025, was well below the prior weekly bearish reading. This history indicates that the small caps were preparing to drop.
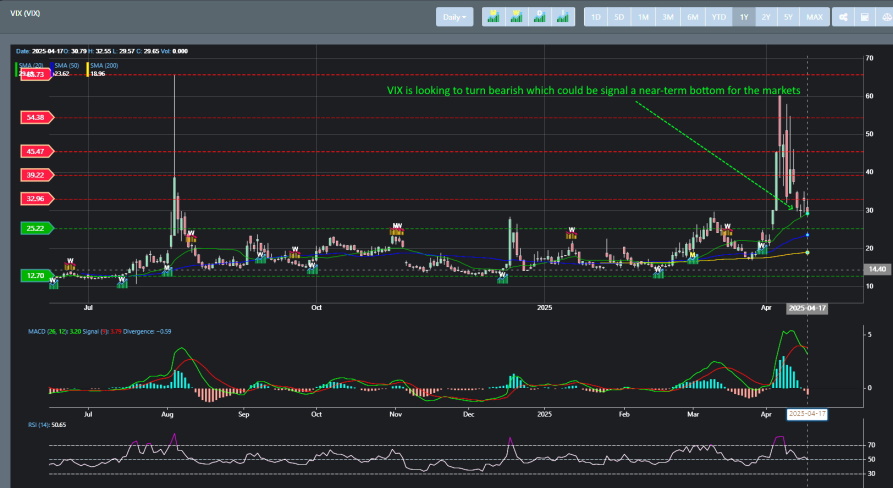
VIX
Another indication that markets were preparing to drop can be seen through VIX. Historically, when our monthly buy signal for VIX triggers, it follows with a drop in the market. When there is both a weekly and monthly buy signal on VIX, this highly suggests that markets will drop. We can see that occurs with the February 17, 2025, weekly buy signal and the monthly buy signal on March 3, 2025. You could have shorted the market or gone with an inverse at this point to maximize any gains from the decline. As it sits, VIX has the potential to trigger a weekly sell signal. There is a strong indication that the counter rally will continue this week.
Concluding
If you have been following our blogs, you will know that we build software to drive on market readings. One key driver that we discovered is that market sentiment is a strong precursor to market price action. Whether short-term or long-term readings impact the markets. As investors, we want to play the contraction regarding market sentiment and price action. This is key and can be difficult because being a contraction can be difficult. You must exclude the biases from market pundits and herd tendencies that mandate that being contrarian is not the right course of action. Being a lone contrarian, where the near-term price action can sometimes suggest that market pundits and herd movement are right, can be challenging to navigate.
Emotions and market volatility compel individuals to avoid potential losses. The heightened price fluctuations, followed by a decline, have resulted in significantly greater instability. This instability fosters a sense of 'fear' and pushes investors towards the behavioral tendency known as 'loss aversion,' which ultimately results in unfavorable outcomes.
Right now, markets have been on a sharp decline since wrapping up Q1. Market breadth has been just as bearish, and market sentiment is reaching all-time lows. However, we are at a point where a potential bottom has been reached, and key indicators suggest that, at the very least, a near-term counter-rally is in play. SPY has rallied to hit its 50% Fibonacci levels from all-time highs, and now it looks like it will drop to somewhere on the next support at the 512 regions. If it can hold in the week or two, it is highly probable to rally back up to its 61.8% reading. This is a tall order, but our market analytics suggest that we may see a rally to the 563 region in the coming weeks.
...


